

Hi Shoppers,
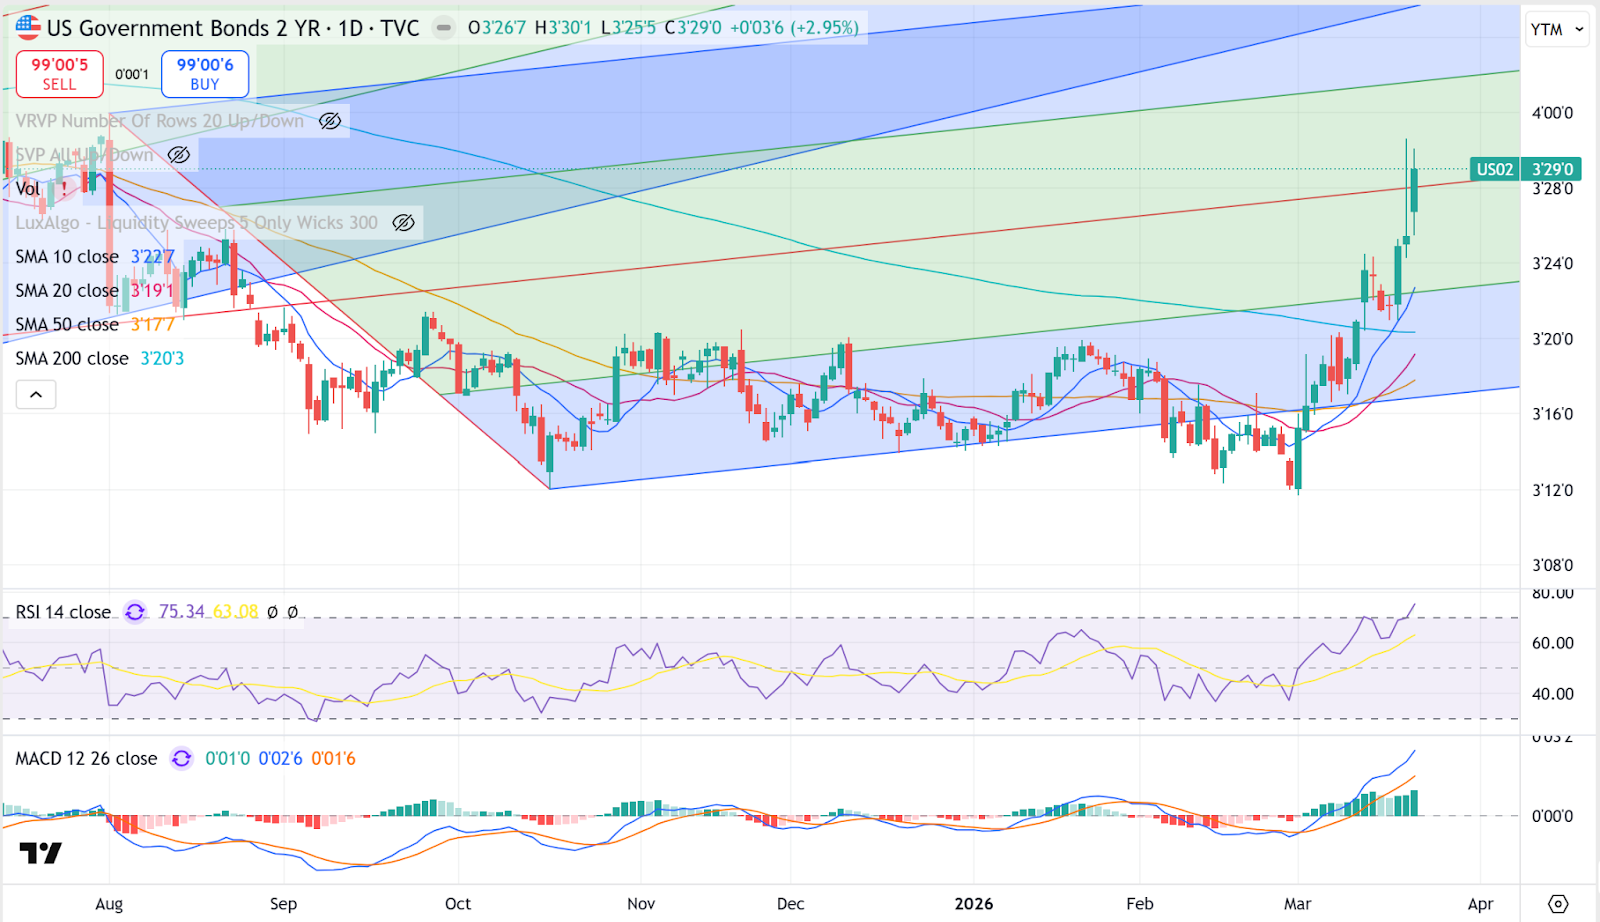
I last wrote about that crazy candle on the two-year bond and how it could be signaling a change in the uptrend.
Well, what it signaled was mass confusion, because bonds collapsed on Friday.
Here is that same chart, which is the inverse showing the yield:
Here is the iShares 20+ Year Treasury Bond ETF (TLT):
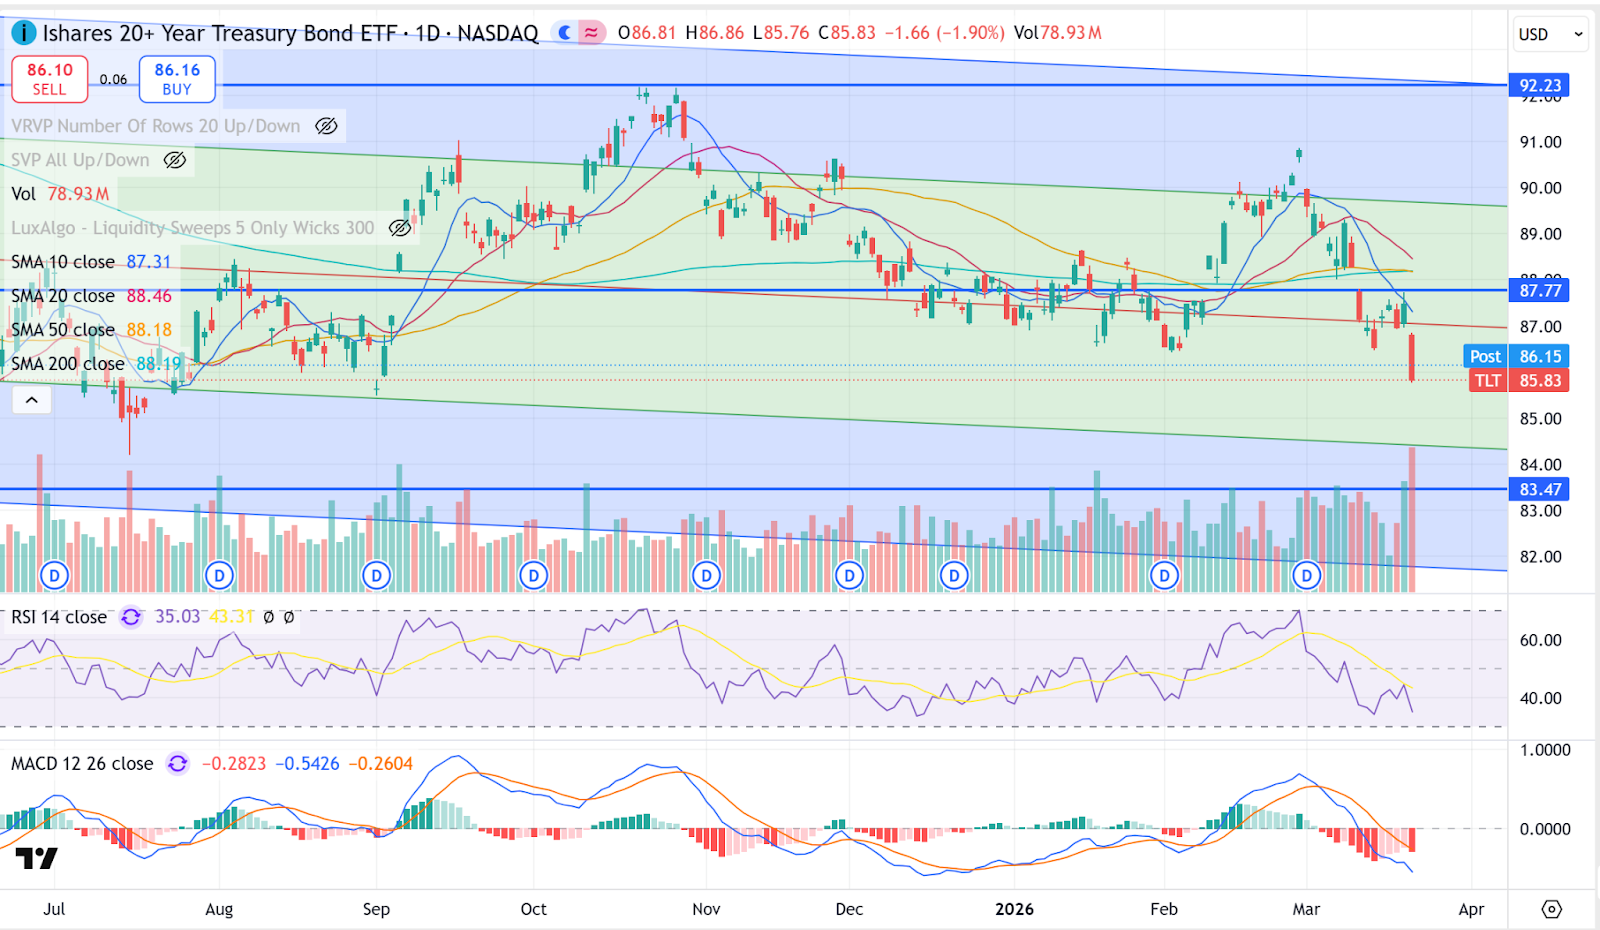
Huge move to the downside, breaking below those lows from early February. Support below here comes in at $84.40 and then $83.47.
Is this due to the war, or have "they" finally caught on to just how hot that PPI number came in on Wednesday?
Will the Fed need to raise rates?
Is this stagflation? A weakening economy without growth, higher inflation and higher interest rates.
Add it to your list of crazy correlations in this very volatile market.
Thank You For Reading. See You Next Tuesday,
Licia Leslie