
The Five-Minute Chart Signal You Missed

Hi Shoppers,

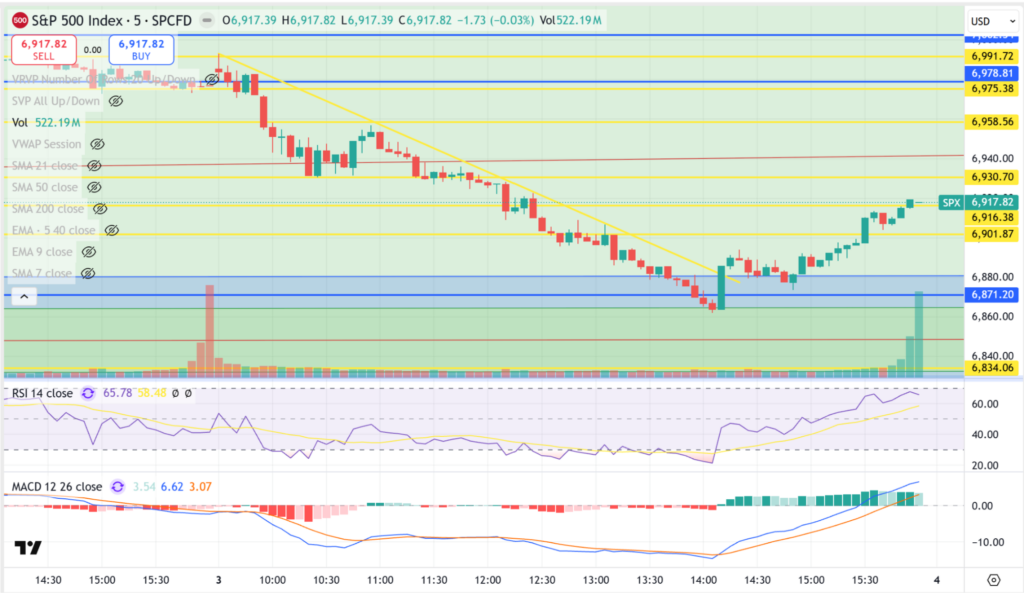
Check this out. It is the five-minute chart on the S&P 500 Index (SPX) from yesterday:

I am a huge proponent of any kind of trendlines you can place on your charts for guidance.

Look at that downward trendline beginning at literally the opening of the day.

It was honored all day until the market found its bottom, where the sellers were exhausted and took their profits and the buyers decided this is a good place to buy.

Not only was that downtrend line pierced, but it was pierced with conviction with that very large green candle right off my pitchfork channel support.

That is your signal to buy: bounce at support along with the breakout over the downtrend that was honored the whole day up until then.

And Mark caught it with this alert:


He closed this trade up 148 percent. In at 45 cents and out at $1.12.


This is in our 0DTE service, which is getting even more heated up with those 0DTE equity stocks that are just beginning to trade.

Tap to call our support team at 888-872-3301 to learn all about it.

Thank you for reading. 

See you next Tuesday,

Licia Leslie

Licia Leslie

Head of Technical Analysis

pit profits

See what's hot at option pit

CAPITOL GAINS: SMR Aug16 7 call closed for a 150% gain

DELTA STRIKE: VLY Mar15 8 puts closed for a 88% gain

PFE May17 26 calls closed for a 66% win

OP MENTORING: SPY Mar22/19 510 put calendars and 520 calls for 6.4% gain

OPTION SHOPPER: ERX Mar28 65 calls closed for a 90% gain

Licia Leslie

Licia Leslie

Share This Article

About the Author

Licia Leslie

Licia Leslie

Former CBOE floor trader and CIO at Karman Line Capital. Author of ‘The Option Traders Hedge Fund’ with over 30 years of options trading experience.

Popular Posts

Categories

Stay Updated

Subscribe to our newsletter for daily trading insights

Upcoming Events

FOMC Meeting

2:00 PM EST

Earnings Season Begins

Pre-market

Options Expiration

Market Close

NFP Report

8:30 AM EST
