

Hi Shoppers,
Monday's S&P 500 rally looked like the all-clear signal. Big green candle, momentum indicators turning positive, buyers stepping back in with confidence.
Don't fall for it.
That rally didn't happen because the stock market found its footing. It happened because oil prices dropped for a few hours after Treasury Secretary Bessent hinted the U.S. would start letting tankers back through the Strait of Hormuz. The moment oil pulled back, stocks popped. That tells you everything you need to know about what's really driving this market.
Here's what I'm seeing: the S&P 500 is a dog on a leash right now, and crude oil is holding the other end.
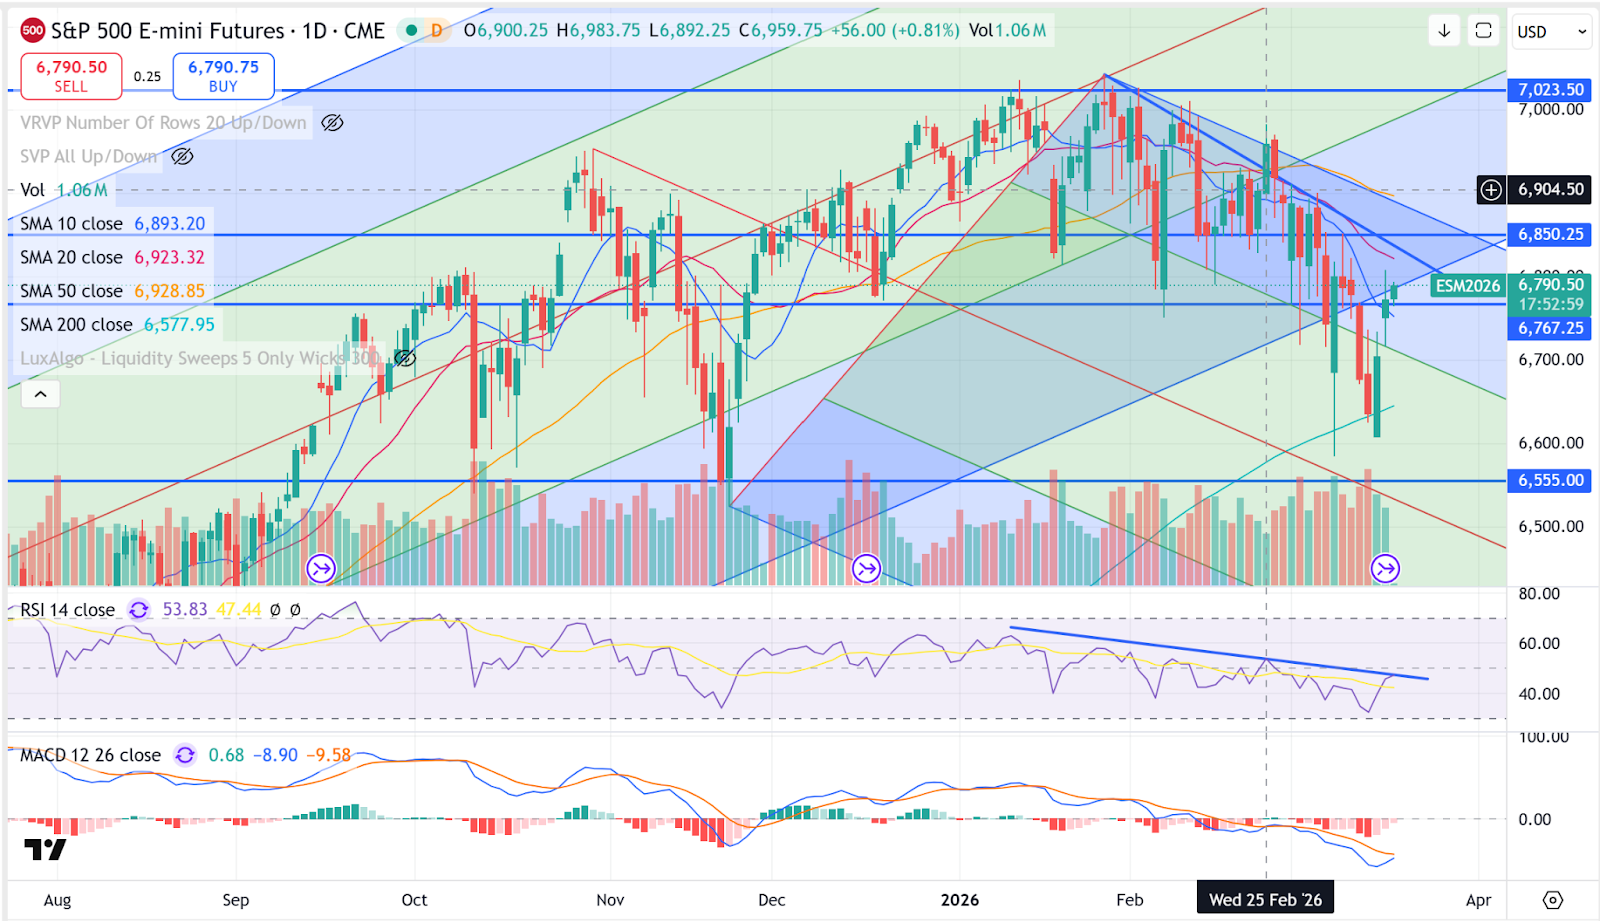
That chart looks encouraging on its own. But it's telling you what happened, not why. Every meaningful move in the S&P this month has followed oil. When crude spiked above $100 a barrel, the index fell to its lowest point of 2026. When oil pulled back Monday, the S&P jumped one percent. The stock chart is reacting. The oil chart is leading.
The 20 Percent Problem
About one-fifth of the world's oil supply normally flows through the Strait of Hormuz, a narrow waterway between Iran and Oman. Think of it as the main valve on a pipe that feeds the global economy.
On March 2, Iran shut that valve. Tanker traffic dropped to nearly zero. Insurance companies pulled coverage entirely, which means even willing ships can't afford to make the trip.
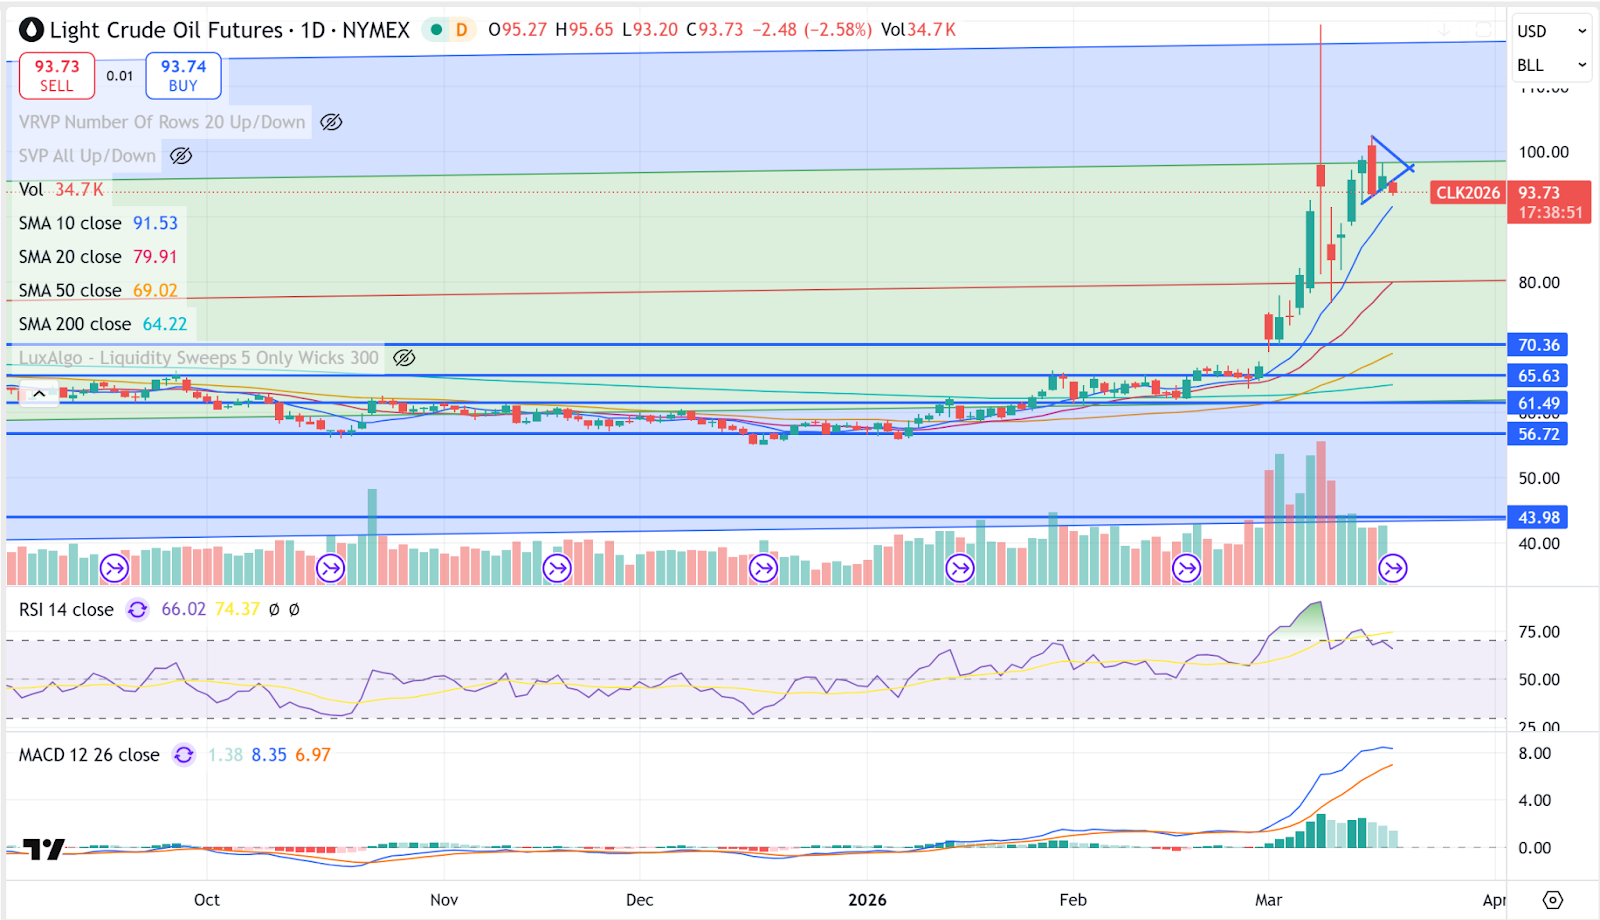
Since the closure, oil has surged from around $65 a barrel to over $103. That's a 60 percent jump in three weeks. And Iran's new supreme leader said last week the strait should stay closed as a pressure tool. This isn't resolving itself quietly.
RBC Capital's Helima Croft called this the biggest energy crisis since the 1973 oil embargo. Back then, oil prices quadrupled and the S&P lost more than 40 percent of its value. What followed was a decade where prices kept climbing even as the economy stalled, like running on a treadmill that keeps getting steeper. We're not there yet. But the parallels are hard to ignore.
Three Roads From Here, One Chart That Picks the Lane
The road ahead splits three ways, and crude oil determines which one we take.
If the strait reopens soon and the damage doesn't stick, oil comes back down. The U.S. Energy Information Administration forecasts oil dropping below $80 a barrel by the third quarter if shipping resumes. That's when stocks rally for real, not on hope, but on actual relief.
If the closure drags on long enough to tip the global economy into recession, oil could fall even further once the strait reopens, because demand would collapse along with it. Stocks would still sell off, but for slowdown reasons, not energy reasons.
The worst road is the one from the 1970s.
If the strait stays disrupted and the economy slows at the same time, we get rising prices with nowhere to grow. The Fed can't cut rates to help because inflation won't let them. Markets have already pushed rate cut expectations out to September because of oil-driven price pressures.
I think the Fed decision this week will be a nonevent. The real event already happened on March 2 when the strait closed. Until it reopens, stop looking at the S&P for direction. Watch crude. If oil breaks below $90, that's your green light. If it pushes back toward $120, where it peaked briefly last week, tighten everything up.
Thank You For Reading … See You Next Tuesday,
Licia Leslie
P.S. Be sure to secure your seat with Andrew and Hannah. They will have a live session Thursday at 7:00 PM ET.