Where Are We on the Charts?

By Licia Leslie

August 4, 2024

Hi Shoppers,


A lot of action on Friday.


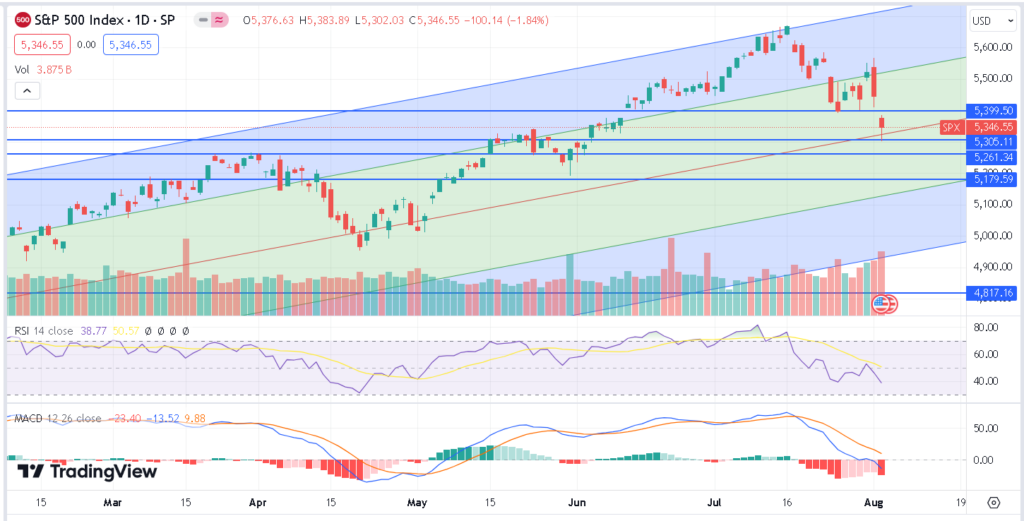
S&P 500 (Ticker: SPX) closed down $100:

We traded down to the nice rounded number just shy of $5300.


Remember those rounded numbers $5300, $5350, $5400 are natural support and resistance levels.


Everyone is watching them.


And we closed just shy of $5350.


So where do we go from here?


Friday’s action did create a nice hammer, which can signal the end of a downtrend, but we have a large gap.


With a gap, if the stock stays in that price area for a few days, it will usually continue in the same direction as the gap.


Unless we begin to rally and fill the gap, we will probably trade lower. 


I have support at $5260-$5250 and then $5200.


On the way back up, that old support at $5400 will now be resistance.


Trade Review


The Russell 2000 ETF (TIcker: IWM) moved before the opening and gapped down so no trade was made.

Thanks for Reading … See You Next Tuesday,


Licia Leslie

Licia Leslie

Head of Technical Analysis

pit profits

See what's hot at option pit

CAPITOL GAINS: SMR Aug16 7 call closed for a 150% gain

DELTA STRIKE: VLY Mar15 8 puts closed for a 88% gain

PFE May17 26 calls closed for a 66% win

OP MENTORING: SPY Mar22/19 510 put calendars and 520 calls for 6.4% gain

OPTION SHOPPER: ERX Mar28 65 calls closed for a 90% gain

Licia Leslie

Licia Leslie

Share This Article

About the Author

Licia Leslie

Licia Leslie

Former CBOE floor trader and CIO at Karman Line Capital. Author of ‘The Option Traders Hedge Fund’ with over 30 years of options trading experience.

Popular Posts

Categories

Stay Updated

Subscribe to our newsletter for daily trading insights

Upcoming Events

FOMC Meeting

2:00 PM EST

Earnings Season Begins

Pre-market

Options Expiration

Market Close

NFP Report

8:30 AM EST