

Each week, I’ll give an overview of a stock and Licia Leslie will follow that up with a chart analysis the next day. Bill Griffo will chime in with macro analysis and Andrew Giovinazzi will then finish out the week with a volatility breakdown.
Hey Traders,
As you know, Mark Sebastian recommends staying away from Transocean Inc (Ticker: RIG) on the long side.
I don’t disagree with him … longer term.
But there could be a short term play in RIG.
Here is the chart for the CME Crude Oil Futures July Contract:
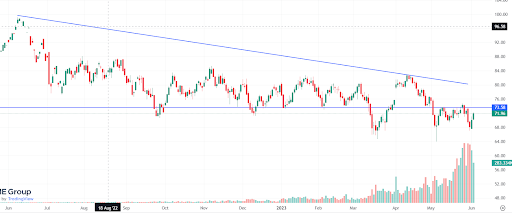
The futures have been in a downtrend for a year now.
But they also look to be bouncing here creating a triple bottom.
On top of that, Thursday’s candle is bullish engulfing. A possible sign of a rally to come.
Looking at the RIG chart, it has also bounced off a support level and has a bullish engulfing candle created on Thursday with follow through to the upside on Friday:
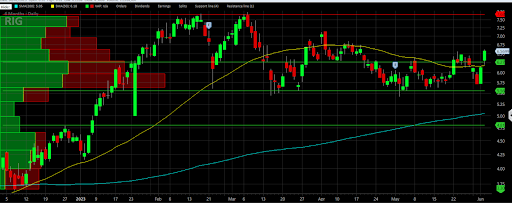
RIG looks to me like it is heading to those previous highs at $7.70.
Use that 50 day moving average as your stop loss on the downside.
Trade accordingly!
Thanks For Reading,
Licia Leslie