Hi Shoppers,
The end of the month gives us a new look at the charts, especially for longer term:
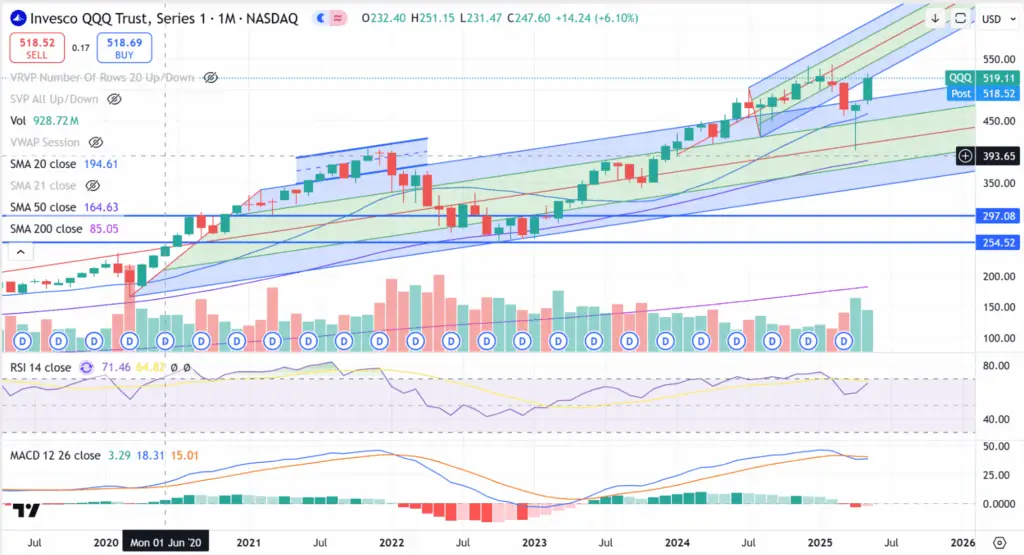
Here is the QQQ monthly chart:
April gave us a beautiful hammer candle bouncing off the median line support signaling a change in the two month down trend.
May gives us the confirmation that we are going to trade higher.
At the very least QQQ will revisit the previous highs at $540 and possibly trade to $570.
Keep this in mind for the longer term as we are being tested on a daily basis with the market moves.
Trade Review
NVDA didn’t trade to the top of my pitchfork but was stopped out by the previous high of Feb18 before reversing lower. I do have support here on Friday’s lows.
Thank You For Reading … See You Next Tuesday,
Licia Leslie