

BY LICIA LESLIE
August 18, 2023
Each week, I’ll give an overview of a stock and Licia Leslie will follow that up with a chart analysis the next day. Bill Griffo will chime in with macro analysis and Andrew Giovinazzi will then finish out the week with a volatility breakdown.
Have a stock YOU want us to review? Email my team here. – Mark
Hey Traders,
I last wrote about Nvidia Corp (Ticker: NVDA) on March 20, 2023 and said it could trade $290.
Well, it traded $290 and then some.
Before its last earnings report on May 24th, NVDA closed at $305.
After the report, it gapped open up $80, trading a high that day of $394.80.
NVDA not only held that breakaway gap area, but managed to trade much higher reaching an all time high of $480.88 on July 14th.
It has since pulled back and its most recent low is $403.11.
Yesterday, it closed at $433.44.
Here is the chart:
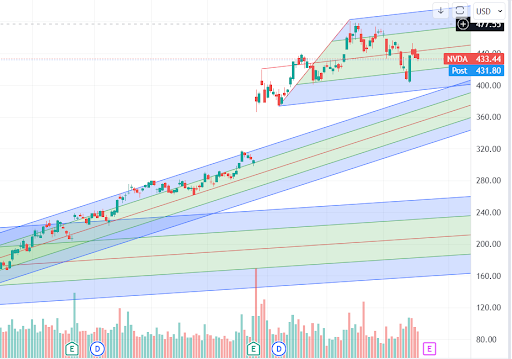
Taking a closer look at the chart, it had a large reversal day on Monday:
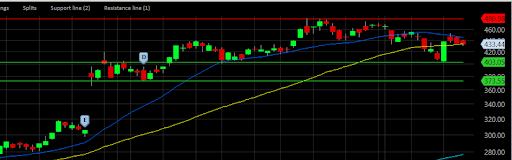
It held the support level at $403 and bounced.
Now it looks like it could be bull flagging off that very large bullish candle.
The flag has held the 50 day moving average at $433.61.
The next level of support comes in at $373.55.
On the upside, resistance is at the previous high at $480 and above that at $495.
Don’t forget the earnings report is due Thursday.
This is a mover.
Thanks for Reading … See You Next Tuesday,
Licia Leslie

