

Hi Shoppers,
Surprised by the selloff?
Well… we had a warning sign.
We knew the market was following bond yields pretty closely.
Did you see that highwave doji on the 30-year bond yield chart that Tuesday’s action created?
Check it out:
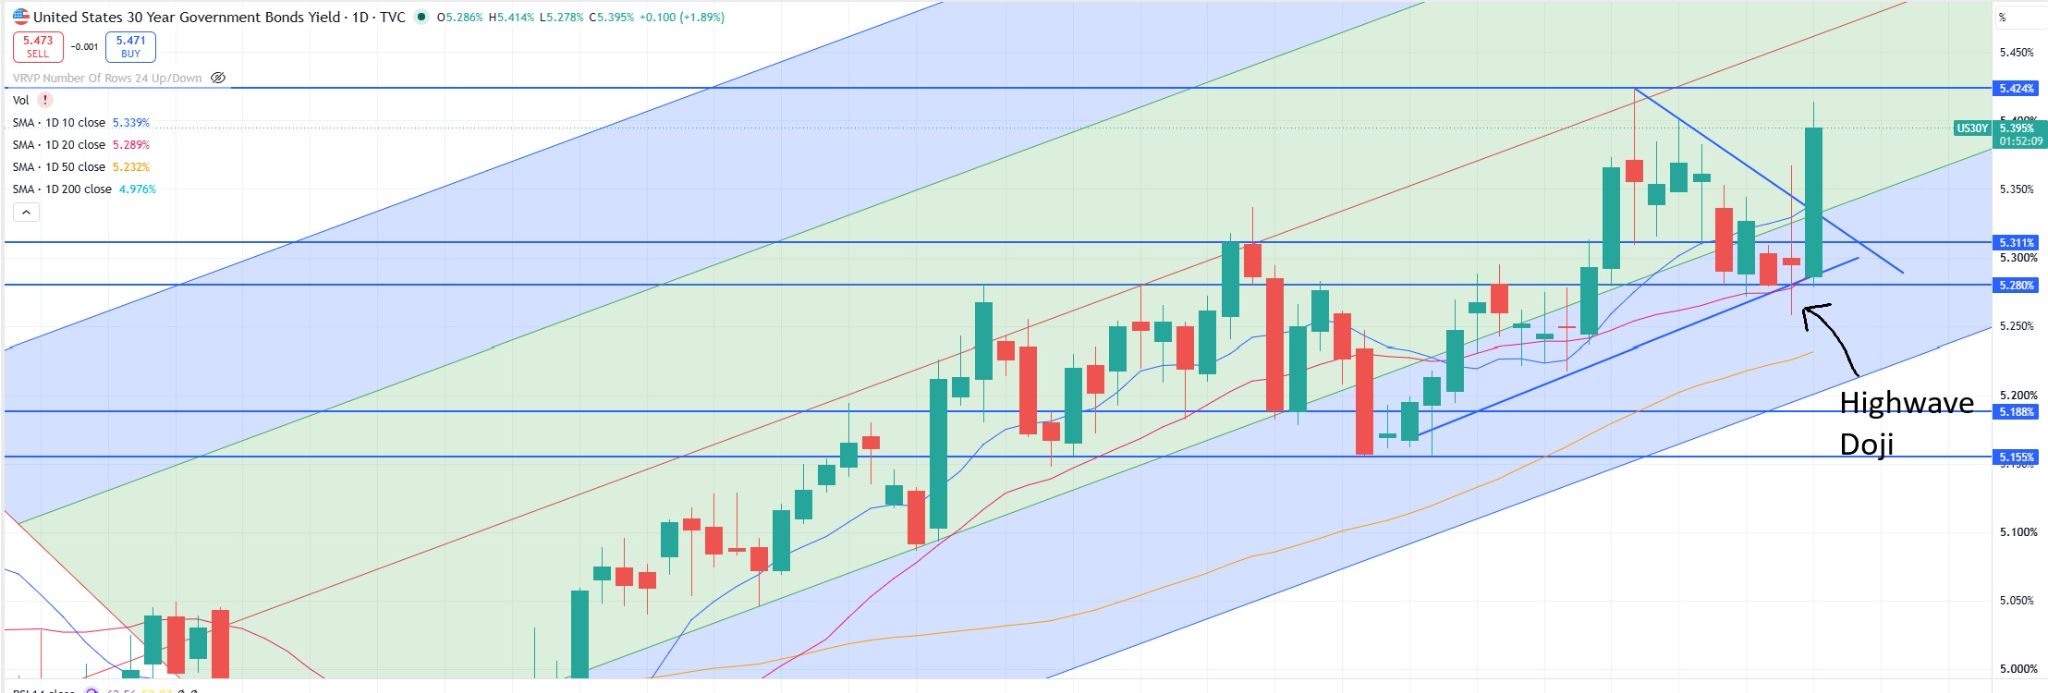
A regular doji signals uncertainty. In other words, who’s in charge? Bulls? Bears? The upper and lower shadow aren’t very long and the main tell is that the opening and closing prices are very nearly the same. Neither side won out or took over.
A highwave doji denotes mass confusion.
You can see it by the length of the upper and lower shadows (wicks, tails). They are very long, showing us that the bulls were in control on the way up only to give up and give the bears control.
Then it closes right near the price it opened at.
We can’t tell who’s in control!
The bulls took over for a massive move following that highwave doji.
The fact that it was at the bottom of a downtrend leans it towards a reversal to the upside.
DO NOT IGNORE THIS CANDLE!
Thank You For Reading… See You Next Tuesday,
Licia Leslie