
|
✓
|
Today's Signal GREEN LIGHT |
It's a real rally as we clear resistance.
Signal by Licia Leslie
| GREEN TODAY: High probability of the market moving higher. |
| YELLOW: Be cautious when making a directional trade. |
| RED: High likelihood of the market dropping. |
Today's Levels
S&P Futures Key Levels · Monday, September 21 · via Licia Leslie
| Level | S&P FUT |
| Resistance 2 (50-day MA) | 7,825.25 |
| Resistance 1 | 7,771.25 |
| Premarket Price | 7,762.75 |
| Support 1 | 7,700.25 |
| Support 2 | 7,596.75 |
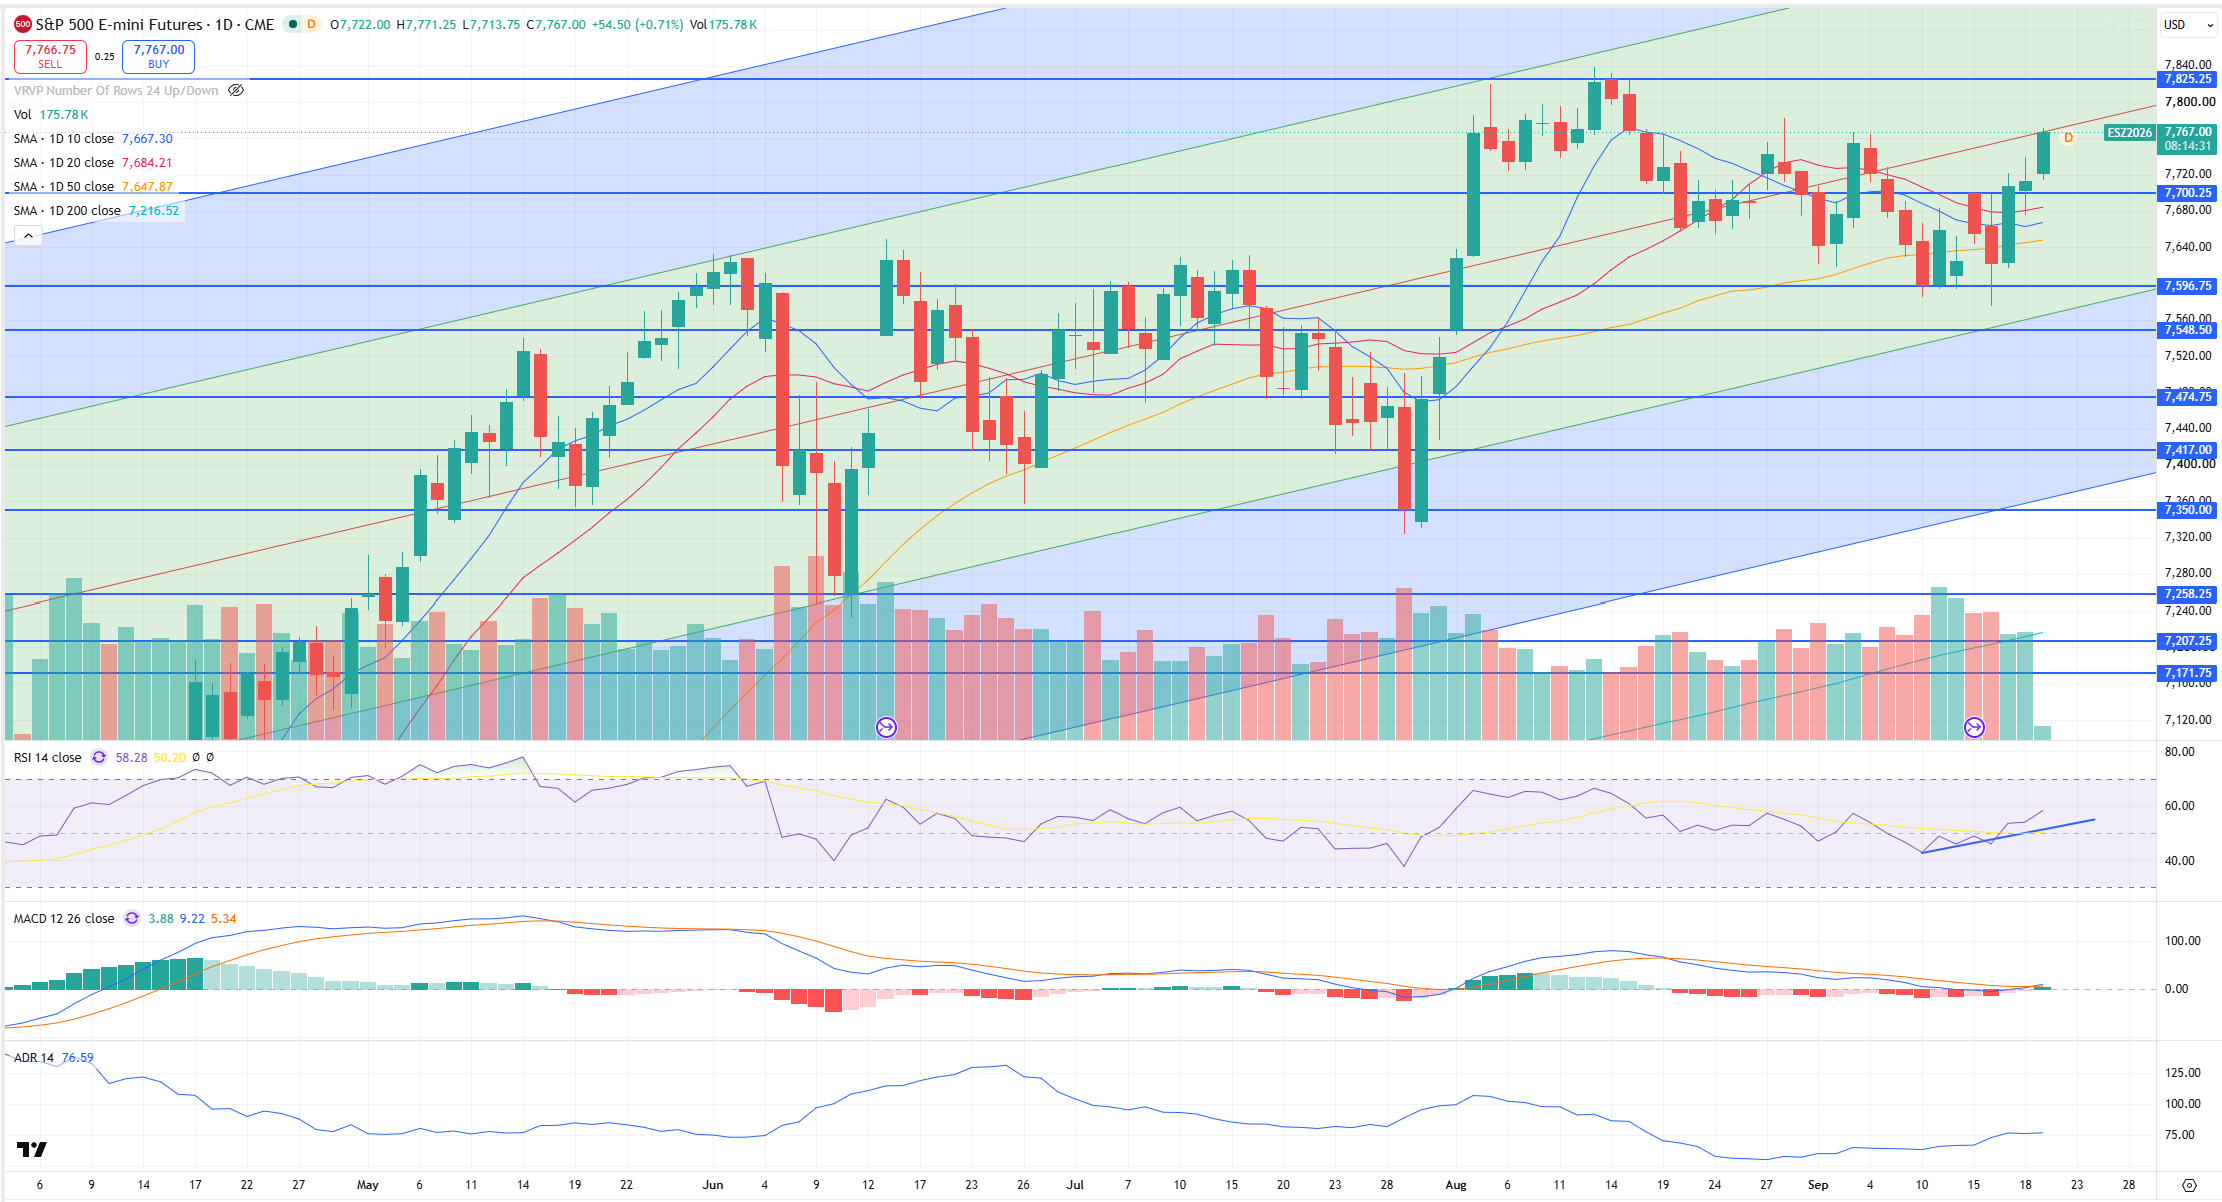 |
Today's high, so far, is resistance as we trade right up to the median line.
How to Use Today's Levels
Red = resistance: watch for price to stall or reverse; a clean break above is bullish.
Green = support: watch for price to hold or bounce; a break below is bearish.
The center row is the premarket reference point for the session. Trade in the direction of today's signal.
The Number
+200%
An SPX 3,850 put that expired Friday, September 18 opened at $0.05. By the high of the day it traded at $0.15, a $10 gain per contract (200%) for traders who caught the move.
Volume Anomaly
SPX 0DTE Volume: 3.3M Contracts
0DTE SPX volume on Friday, September 18 came in at 3.3M contracts, roughly 19% above the 20-day average of 2.8M. Call and put activity were roughly balanced, with 1.6M calls vs 1.6M puts. The heaviest call volume concentrated at the 7,650, 7,640, 7,630 strikes. On the put side, the 7,620, 7,625, 7,600 strikes saw the most action. The put/call ratio finished at 1.02, a fairly neutral read from the options market.
Editor's Note
 |
Licia Leslie 0DTE Analyst, Option Pit |
We are breaking out of the box range today with both the relative strength index and the MACD moving bullish. Both yields and crude are pulling back helping fuel this rally. Once we clear today's high, we will retest the all time highs.
Yesterday's Close
|
SPX 7,650.50 +0.17% |
VIX 14.81 -4.08% |
SPY 761.69 -0.12% |
QQQ 721.45 +0.63% |