Hi Shoppers,
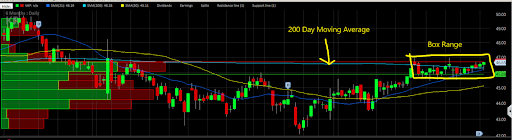
The Kroger Company (Ticker: KR) chart is looking like a lot of the charts out there: mass consolidation.
The Japanese call it the Box Range.
It occurs when a stock is trading in a tight range for a period of time.
Generally when a stock creates this pattern, the move outside the box range is a good size move.
KR is making higher highs and higher lows gearing up for a move to the upside:
It has closed above the 200 day moving average for the last four days.
On the weekly chart, KR has closed above the 50 period moving average.
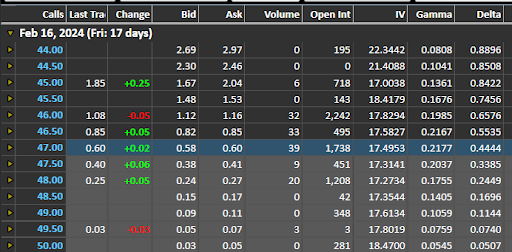
I will be watching for KR to trade above $47 and then I will be shopping for calls in the Feb16 expiration cycle:
The Feb16 47 calls are fairly priced.
Once KR clears $47, it is free to trade up to $49.
Use a close below the 200 day moving average as your stop loss.
Trade Review
Marathon Digital Holdings (Ticker: MARA) is still flirting around the 50 day moving average, but the chart is intact with a close above $17.50.
The United States Oil Fund (Ticker: USO) is gearing up for another leg higher.