

Each week, I’ll give an overview of a stock and Licia Leslie will follow that up with a chart analysis the next day. Bill Griffo will chime in with macro analysis and Andrew Giovinazzi will then finish out the week with a volatility breakdown.
Hey Traders,
I am not a crazy huge sports fan, but I like to watch the Blackhawks.
Which, by the way, had a horrible season … BUT they picked up Connor Bedard.
According to my son he could be the best player of all time.
Can’t wait to watch him.
I have also gotten into college football.
We had such a fun season watching TCU.
As far as the gambling end of it, no idea.
But I can read the stock chart.
Draft Kings (Ticker: DKNG) has had a really nice rally since the beginning of the year where it made a double bottom at $10.69.
It closed yesterday at $25.66.
That’s up 58%!
Since that nice runup, DKNG has been in a consolidation mode.
The general rule for consolidation is the stock is taking a pause or breather gearing up for its next leg higher or lower, continuing in the same trend it is in.
For DKNG that is higher.
The consolidation range has been $24.75 to $26.60.
I do have some pretty good resistance at $26.60.
Check out my pitchfork:
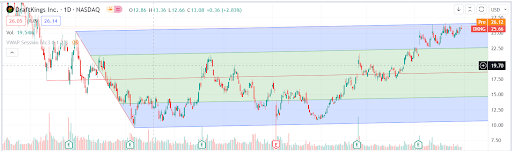
So where does it go from here?
Once DKNG breaks out and closes above $26.60, the next stop is $31.
The $26.60 resistance level becomes your new support level.
Use a close below there as your stop loss.
And trade accordingly.
Thanks for Reading … See You Next Tuesday,
Licia Leslie