

Each week, I’ll give an overview of a stock and Licia Leslie will follow that up with a chart analysis the next day. Bill Griffo will chime in with macro analysis and Andrew Giovinazzi will then finish out the week with a volatility breakdown.
Have a stock YOU want us to review? Email my team here. – Mark
Hey Traders,
Our stock this week is Cboe Global Markets (Ticker: CBOE).
Which is a HUGE part of my personal history.
It was called The Chicago Board Options Exchange or The CBOE back then.
Lots of great memories were created from 1986 to 2003.
Anywho, let’s take a look at the daily stock chart.
CBOE has been recently trading at all time highs around $140.
Its last visit there occurred yesterday, when it couldn’t close above that resistance and has since begun to roll over.
Now it’s violating its 50 day moving average:
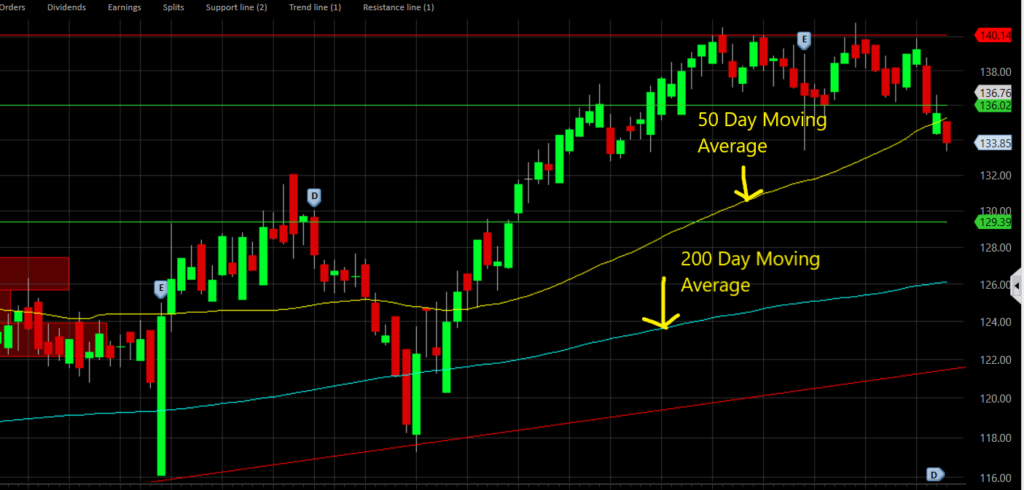
Looks to me like CBOE is ready to trade lower.
Perhaps to $129.50.
From there it could fall down to the 200 day moving average at $126.25.
Check out the volume profile which has a massive thin zone down from $134 to $127.50.
If you do decide to play this down side, start with using the 50 day moving average as your stop loss and keep a trailing stop loss as the stock moves your way.
That way, you keep most of your profits.
Trade accordingly!
Thanks For Reading … See You Next Tuesday,
Licia Leslie