

Hey Shoppers,
We may be seeing some relief in the bond yield rally.
Long-term yields have run hard. On Thursday, the 30-year Treasury yield pushed up near 5.69% intraday, a level we haven't seen in more than 20 years, then reversed and closed around 5.60%.
Here's the United States 30-Year Government Bond Yield chart:
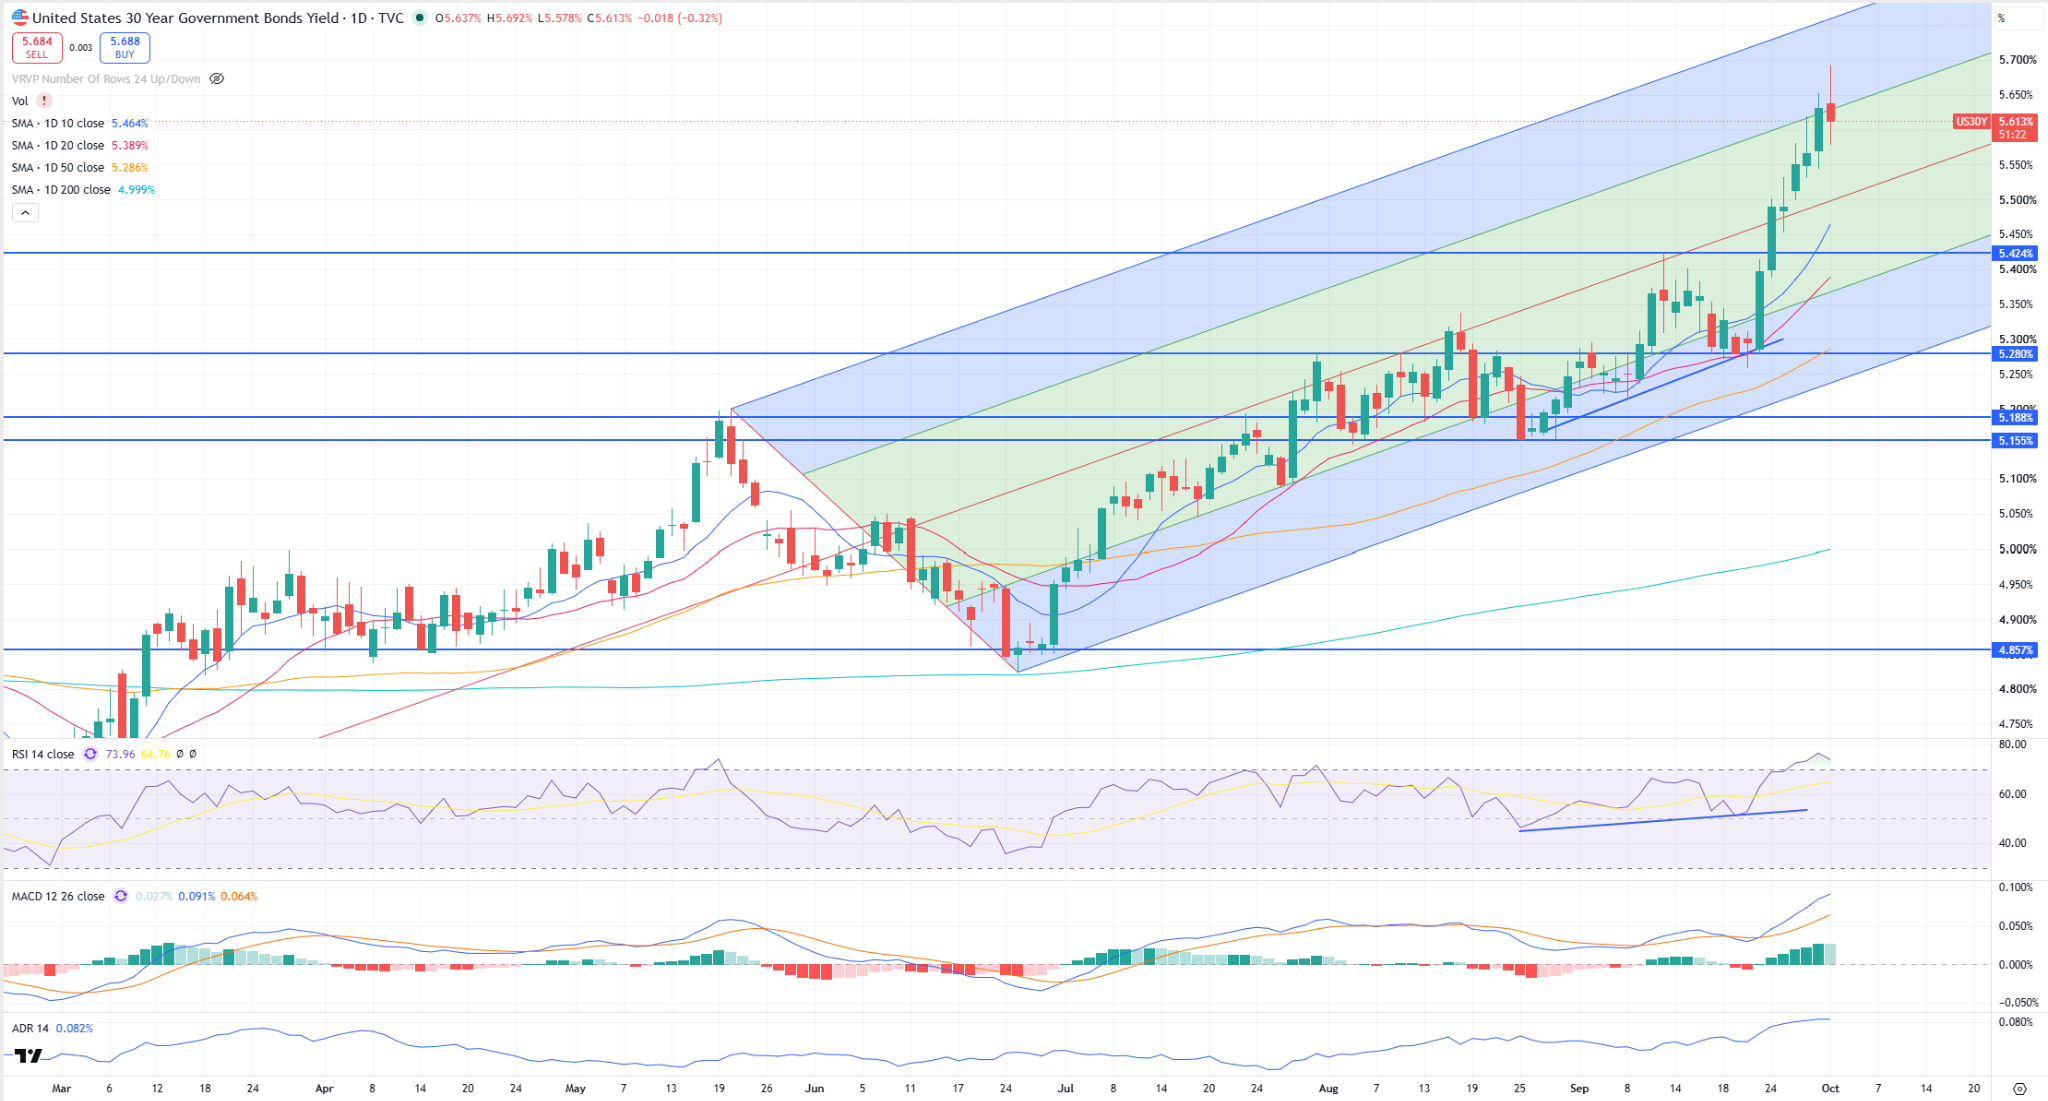
After climbing up the pitchfork and honoring our support and resistance levels, the yield printed its first red (bearish) candle in seven straight days on Thursday. That candle sits right at the top of the channel, which is resistance.
Now I need confirmation. I want to see the yield open and trade lower on Friday. I'd also like to see the Relative Strength Index drop back below 70, which is a bearish signal.
The strategists at BTIG flagged the same thing on Thursday. They said the run in the 30-year looks stretched in the short term.
You can see the mirror image on the iShares 20+ Year Treasury Bond ETF (TLT) chart:
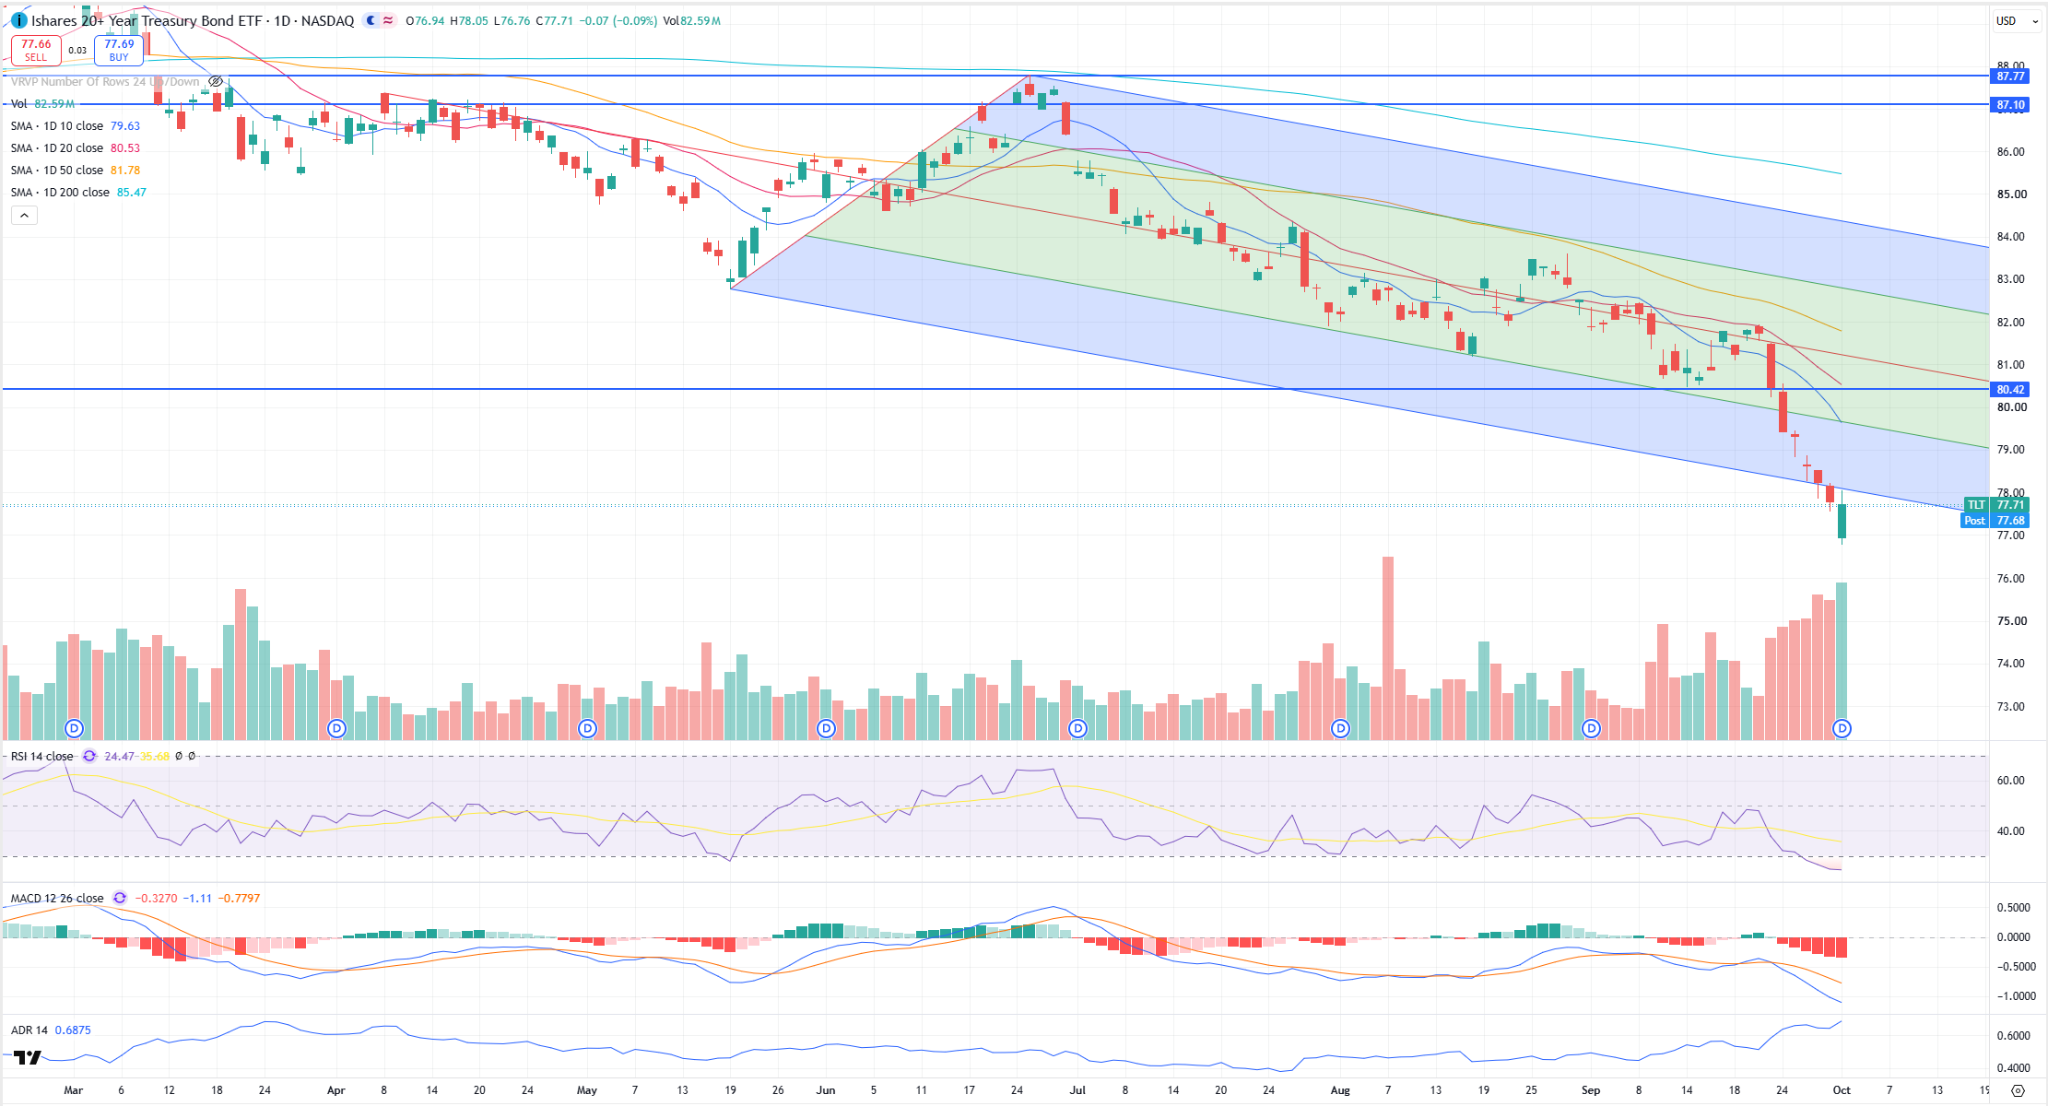
TLT dropped to $76.76 on Thursday, its lowest price in more than a decade, then bounced to close at $77.71. That action created a very bullish belt hold candle, which can signal a change in this downtrend.
Again, I want confirmation, with TLT opening and trading higher on Friday. The Relative Strength Index also needs to climb out of oversold territory and back above 30.
If both of those happen, we can hop into those inexpensive TLT calls.
For the record, Mark Sebastian likes this play, too.
Thank You For Reading… See You Next Tuesday,
Licia Leslie