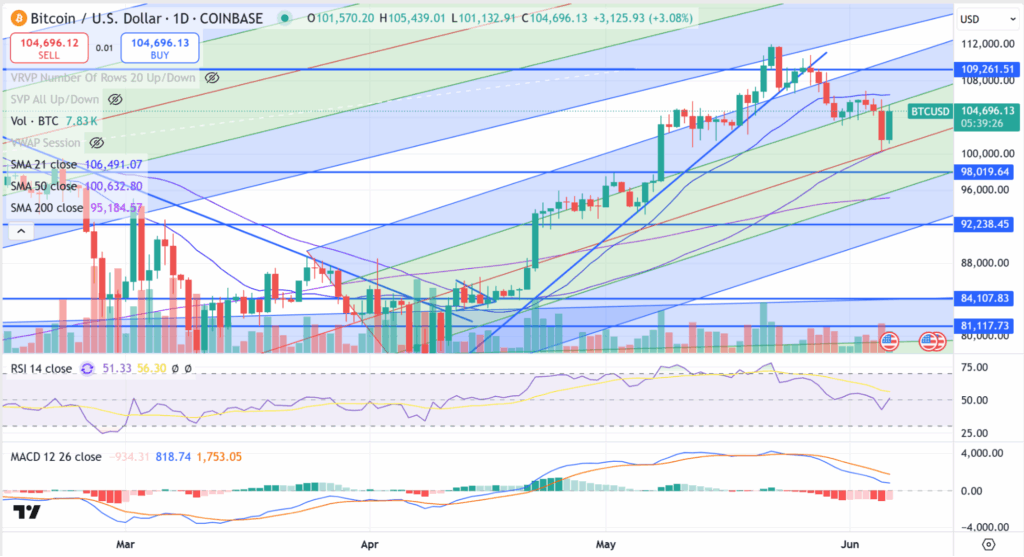
BTCUSD sold off on Thursday trading down to the median line which lines up perfectly with the 50 day moving average (love when that happens) and today is bouncing off that support creating a beautiful bullish candle.
On the iShares Bitcoin Trust (Ticker: IBIT) chart it is showing up as a harami candle because it trades less hours:
The harami candle also denotes a change in trend, in this case the downtrend.
A close over $60.25 and I will be shopping for IBIT calls.
Thank You For Reading … See You Next Tuesday,