

Dear Trader,
Yesterday I told you the market writes the news before reporters do. The price action IS the story, and by the time CNBC explains what happened, the trade is already over.
Today I want to show you the pattern that matters most right now. The one I've been watching for months while smoke signals piled up around it. If you're new here, I've been tracking these signals since I came back to the markets. You can read about it here and here.
Here's what I've been seeing.
Gold ripped from $2,600 to over $5,500. Central banks bought over 1,000 tonnes in 2024, rotating out of Treasuries and into hard assets. Hedge funds followed. Then retail piled in. Same order it always happens. The move was about the dollar. It was about Treasury concerns. It was institutional money voting with their allocation.
A Danish pension fund announced they were selling their entire US Treasury position. $100 million. A rounding error in a $28 trillion market. But the message wasn't the quantity. The message was what they said: "The U.S. is basically not a good credit, and long-term, U.S. government finances are not sustainable."
They said the quiet thing out loud.
Within days, other European funds confirmed they'd been doing the same. Sweden's Alecta dumped $8 billion. More Danish funds followed. Not coordinated. But not by coincidence either. A narrative formed in real time.
At Davos this year, Ray Dalio warned that we're "on the brink" of a capital war — countries attacking each other by weaponizing the flow of money. This also mentions the Danish and Swedish pension funds selling.
Then Trump blinked at Davos. He'd spent weeks threatening 25 percent tariffs on Europe over Greenland. Forty-eight hours after the pension fund headlines hit, he announced a "framework deal" and moved on. That was fast, even for him. Wall Street calls it the TACO trade: Trump Always Chickens Out. When markets wobble, he folds.
All of these smoke signals pointed the same direction: the Treasury market.
So I pulled up the 10-year chart. What I saw confirmed what I'd been feeling.
The most important chart in global finance is coiling inside a pattern that has to resolve soon. And the signals building around it suggest the move is closer than most people think.
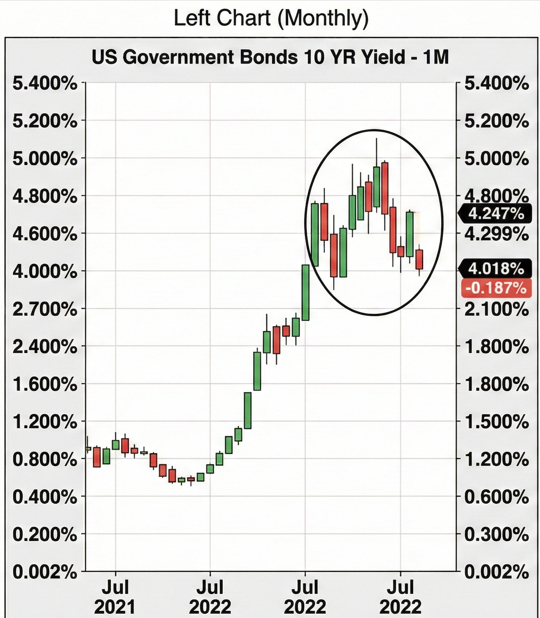
Look at the chart: The Flag
The 10-year is the poster child of the Treasury market because it's what everyone quotes. It's the benchmark. Mortgages reference it. Corporate bonds spread off it. CNBC puts it on the screen. So I'm going to use it for this example. But when we dig deeper, you'll see why the 30-year is likely driving the next move.
In 2020, the 10-year was nearly zero percent. That insanely low level only makes sense when you recall Covid. From there, yields ripped to almost five percent in 2023. That's a massive move. The yield spent the last two years chopping sideways, bouncing around 4.25 percent like a magnet.
That's a flag pattern. A giant one. With monthly bars.
If you read my writing on gold here and here, you've seen this setup before. It's the same structure I'm watching there. Flags tell you the market is coiling and holding its breath. Buyers and sellers disagree, trying to figure out who's right, while everyone waits for new information.
Flags don't last forever. They end. This one is likely to end before spring does.
Right now, the 10-year tests the lower boundary of the flag. Pressing against the bottom of a range it's been stuck in for two years. That test might fail. It might break through. Nobody knows which.
What I do know is that flags give you a clue about the size of the coming move. The measured move on this one would imply something absurd: an unthinkable nine percent or one percent. So let's set the map aside. The 10-year isn't going to nine percent and it's likely not going back to one percent. But when this flag resolves, the move will be large enough that you want to be positioned before it happens. Not after.
Why This Matters More Than Almost Anything Else
The 10-year yield is the price of money. Everything else is downstream.
When yields move, mortgage rates move. Corporate borrowing costs move. The math on government debt changes. Stock valuations compress or expand. The dollar reacts. Gold reacts. Trump reacts.
That last part isn't a joke. Watch what happened in January. The 10-year spiked. European funds made headlines about selling Treasuries. And within 48 hours, Trump's entire posture on Europe shifted. He folded because someone on his team explained what happens if the Treasury market reprices.
The 10yr is his constraint. It's the one thing he can't negotiate with.
So when I see a flag pattern on the most important chart in global finance, I pay attention. Not because I want to trade the 10-year itself. The profit you could make trading Treasury options is irrelevant compared to what's coming everywhere else.
Let me be clear: if you go buy weekly options on iShares 20+ Year Treasury Bond ETF (TLT) because you read this, you'll probably lose money. Playing breakouts in weekly options using a monthly chart as your signal is the recipe for destroying your account by overtrading. This is not a trade. Yet. This is a narrative forming. And when it ends, there will be trades everywhere.
Direction Tells You What Moved. Why Tells You What to Do.
Here's what most people get wrong: they think yields up means stocks down, and yields down means stocks up. It's not that clean. Which part of the curve leads matters as much as direction. Why the curve moves matters even more.
The reason changes everything about which trades work, which sectors rotate, and whether you should be aggressive or defensive.
Direction tells you what moved. Why tells you what to do about it. I'll show you exactly what I mean over the next two pieces.
What’s Next
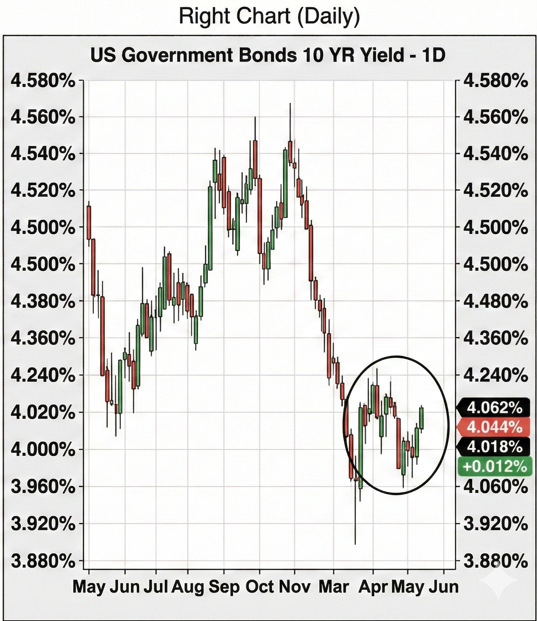
The move in Treasuries over the last five sessions has the 10-year testing the lower part of the flag. As usual, it looks ready to break out of the range.
Tomorrow I'll walk you through the first scenario: what happens if this flag breaks to the downside. Rates fall. What moves. Where the opportunities are. And how to tell the difference between the version of "rates down" that's a gift and the version that's a warning.
Tim