

[OP Ed. Note: This Editorial Was Drafted Without AI]
Yo Pit Crazies,
The VIX curve went flat on me this week, and Meta Platforms (META) had a lot to do with it.
Meta beat on revenue Wednesday night and still got taken out back on Thursday. The stock fell 7% to $648.85, and the Nasdaq had its worst day since June. Meta’s going to spend a ton on AI, and it wants a new class of non-voting shares so it can raise cash for the buildout without Zuckerberg giving up a single vote. Capex hit $34.9 billion last quarter, and free cash flow went negative for the first time since 2012. Meta’s own board committee warned that borrowing on that scale could hurt its credit rating.
As with all big cap AI names, this didn’t end well. When Meta rolled out its snazzy new AI model, Muse, the stock ran up more than $100. Now that it has to pay for all this stuff, it’s given more than $100 back. I think that’ll be the pattern for AI stocks the rest of this year. Meta’s roughly unchanged for 2026 despite 26% revenue growth.
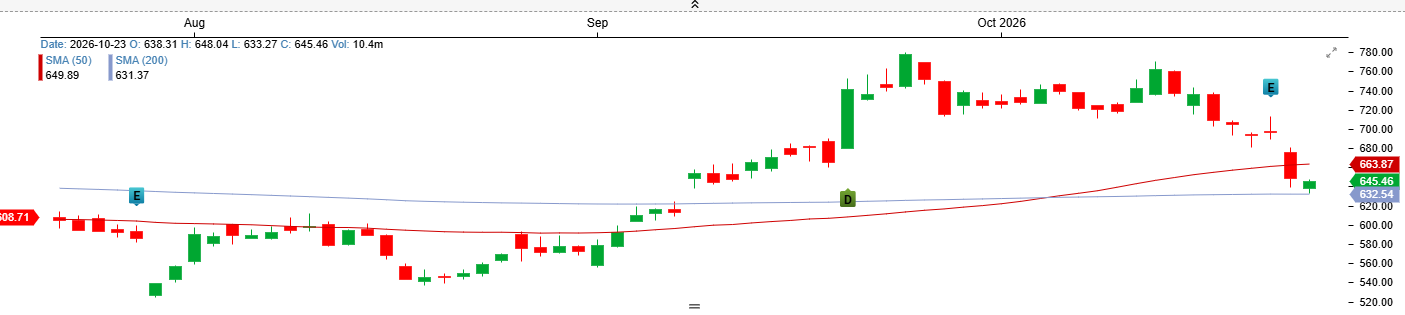
3-Month META Chart
META and most of the hyperscalers are just unchanged for the year. Apple Inc (AAPL) is making all time highs mostly because their AI investment is 0. Investors are still unsure who wins the AI race. That uncertainty at the top end brings in a lot of stocks for money to run too for the 4th quarter.
Most of the hyperscalers are going nowhere this year, or worse. Apple closed at an all-time high Thursday, mostly because its AI spending is tiny next to Meta’s. Investors still don’t know who wins the AI race, and that doubt at the top is sending money into everything else for the fourth quarter. Through Thursday, the S&P 500 ex-AI index was up 6.6% for October while the regular S&P 500 was down a hair. Energy and consumer staples are up double digits this month, and tech and communication services are each down more than 5%.
The Market Does Not Know What to Do
I spent the week in my XFactor course showing new students how to spot market tops and bottoms, and it only cost $1.00! My favorite tool for that is the VIX curve, and right now the front of it’s very flat. In the chart below, the green VIX cash line and the November and December futures all sit between 19 and 19.50, and December’s actually trading a dime under November. On Tuesday, November futures sat more than a point above cash. That flattening tells me the market has an extreme amount of doubt about where things go in the short term.
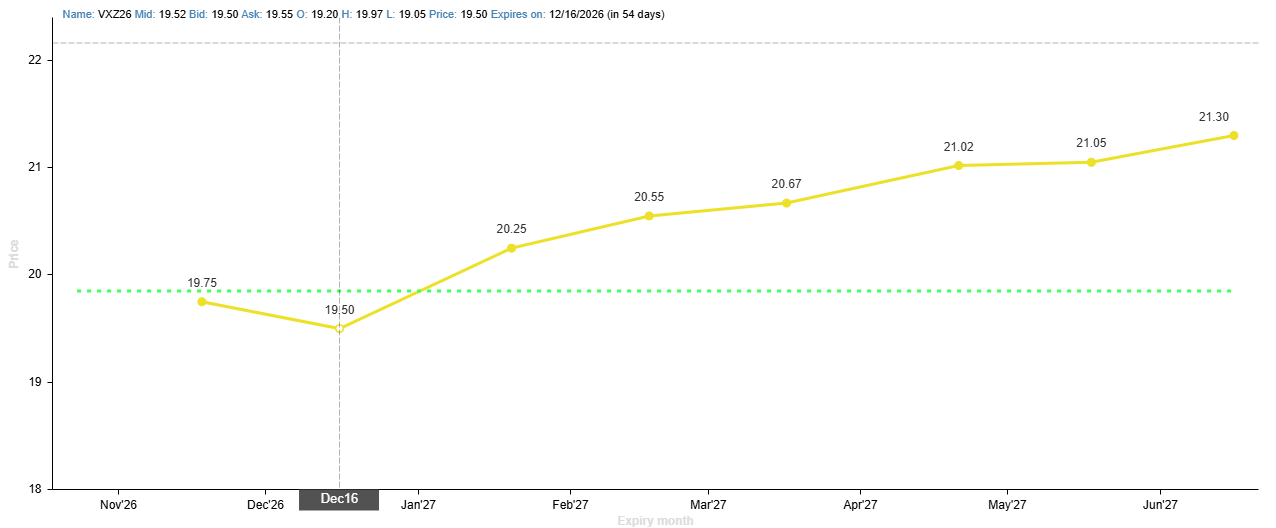
VIX curve Friday, Oct 23, 2026
We’ve got the FOMC next week, the election the week after, more Big Tech earnings, the Anthropic IPO right behind that, and what I think is a quick end to the Iran war once the election’s over. No wonder the VIX curve’s confused. Don’t be surprised if the SPDR S&P 500 ETF Trust (SPY) finishes next week 10 points away from where it opens Monday.
The next two weeks will be a hoot.
I hope this was helpful,
AG