

Each week, I’ll give an overview of a stock and Licia Leslie will follow that up with a chart analysis the next day. Bill Griffo will chime in with macro analysis and Andrew Giovinazzi will then finish out the week with a volatility breakdown.
Have a stock YOU want us to review? Email my team here. – Mark
Hey Traders,
I was never really a Target (Ticker: TGT) shopper.
It just wasn’t very convenient in Chicago.
I do know a lot of people who love it.
My sister-in-law just came in the other day with a new bathing suit when she went there for paper towels.
Looking at the chart, TGT made a double top at $267 in August and November of 2021.
On its earnings announcement of May 18, 2022, TGT plunged from $215 to a low of $155 that day.
It has since traded in a range of $176 on the high side and $147 on the low side.
It has twice dipped down to $140.
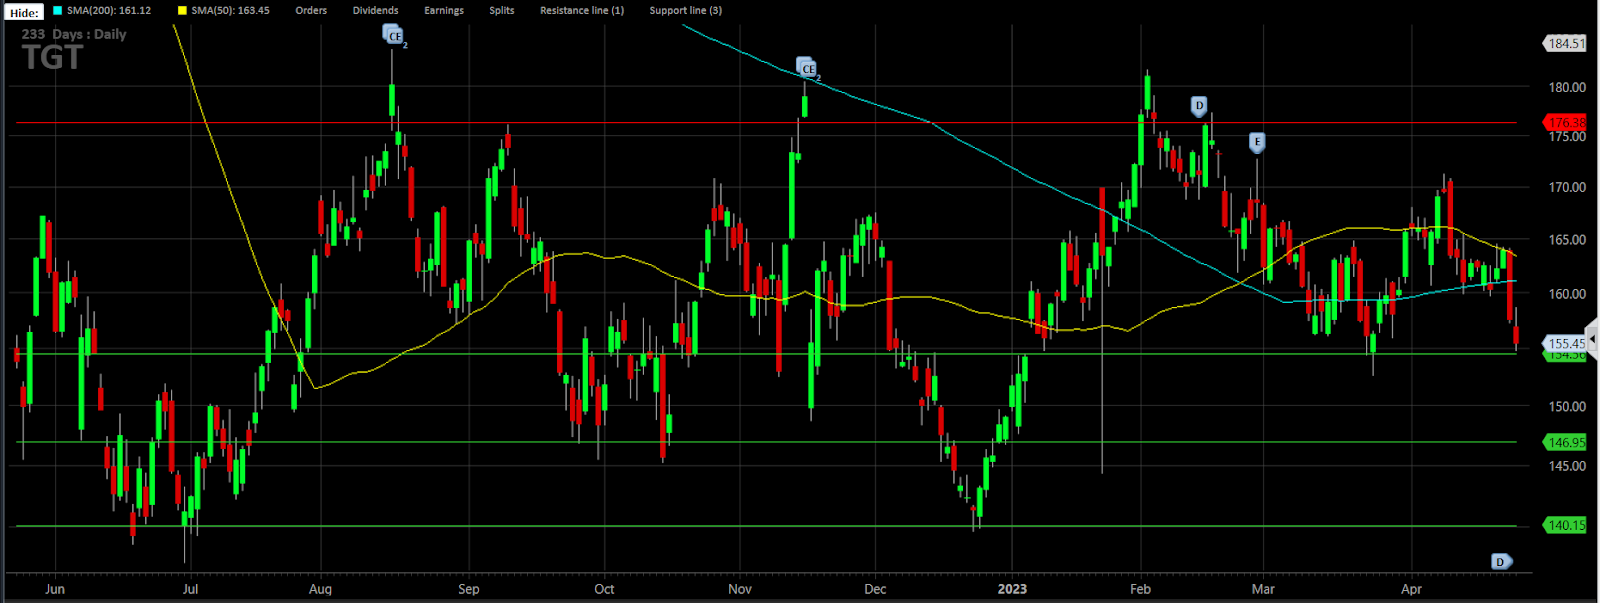
Most recently the support level comes in at $154, which is being challenged today.
If TGT closes below this support level, look for the next stop to be $147.
If it manages to bounce off this support, the next resistance level will be the 200 day moving average coming in at $161.
Remember it’s the closing price that matters most when using the support and resistance levels.
Trade accordingly!
Thanks For Reading … See You Next Tuesday,
Licia Leslie