Hey There Income Hunters,
Most central banks continue to debate the timing of tapering and raising rates.
But China?
Last week, they announced a reduction in their bank reserve requirements.
That shift in monetary policy could cause a shakeup in market trends starting this week.
And it’s an important one because …
-
-
- The markets will get a look at the consumer price index (CPI) on Tuesday
- Janet Yellen and the US Treasury will issue more than $120 billion in Treasury supply
- Earnings season kicks off
-
So, let’s take a look at inflation, interest rates, the dollar, bonds and equities today as the stage gets set for the rest of the month …
And check out the charts inside that will prepare you to take advantage of potential trend changes and psychological shifts that may offer awesome profit opportunities this week.
US Dollar Index (DXY)
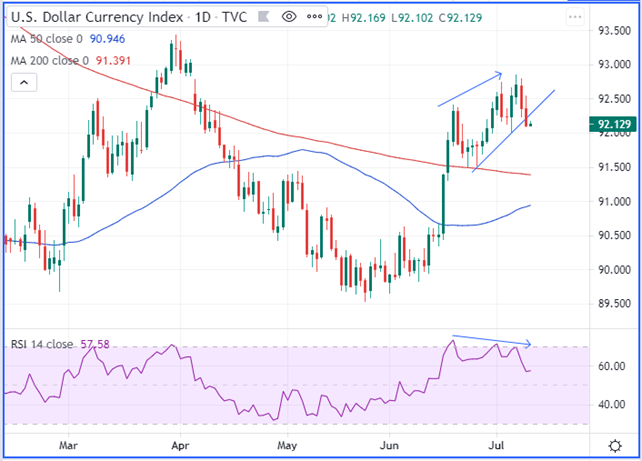
The dollar is a critical signpost for bond and commodity prices …
And last week, as seen in the chart above, the currency’s trend changed.
Not only did the dollar’s uptrend break, but we also saw a bearish price/relative strength index (RSI) divergence. (The latter is a key momentum indicator.)
This makes me think we will see a weakening dollar trend develop in the months ahead.
I am long the Invesco DB US Dollar Index Bullish Fund 25-strike puts expiring Jan. 2022.
Consumer Price Index (CPI) Forecast
June CPI will be announced on Tuesday and expectations are for a headline rate of .5% — a drop from the .6% recorded in May.
Notice the Bloomberg forecast for the quarters ahead…
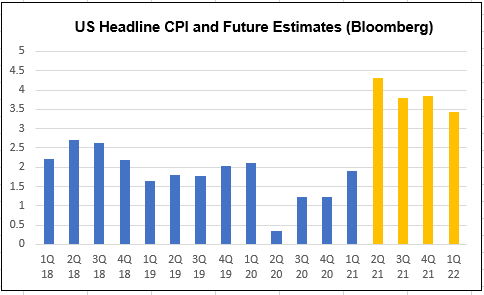
Don’t be fooled by the headline drop year-over-year drop because, as the chart below illustrates, absolute inflation will continue to rise …
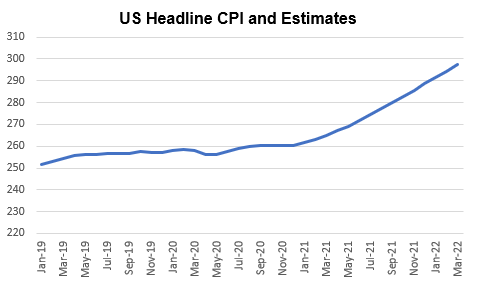
A large infrastructure spending bill will only extend the potential for higher inflation …
And, absent the Fed capping interest rates, that will lead to lower bond prices/higher yields and a lower dollar.
iShares 20+ Treasury Bond ETF (Ticker: TLT)
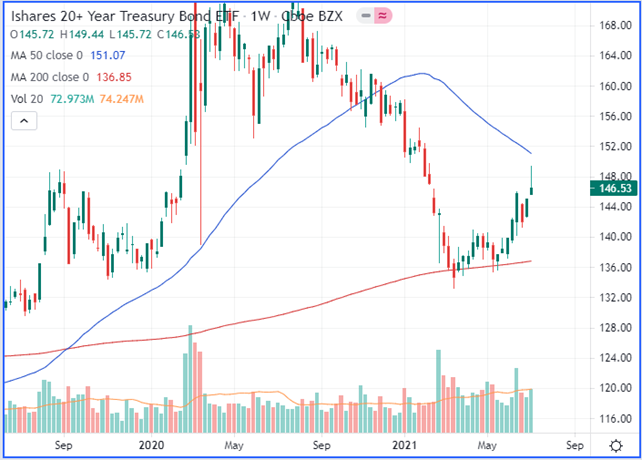
Last week ended with a TLT shooting star candlestick — that’s a long stem above a short body at the top of an uptrend.
It’s a bearish reversal pattern, and lower close this week would confirm it.
With more than $120 billion in Treasury supply on deck this week, the probabilities favor lower TLT prices
So, I am long a TLT July 16 146 puts.
JD.com Inc (Ticker: JD)
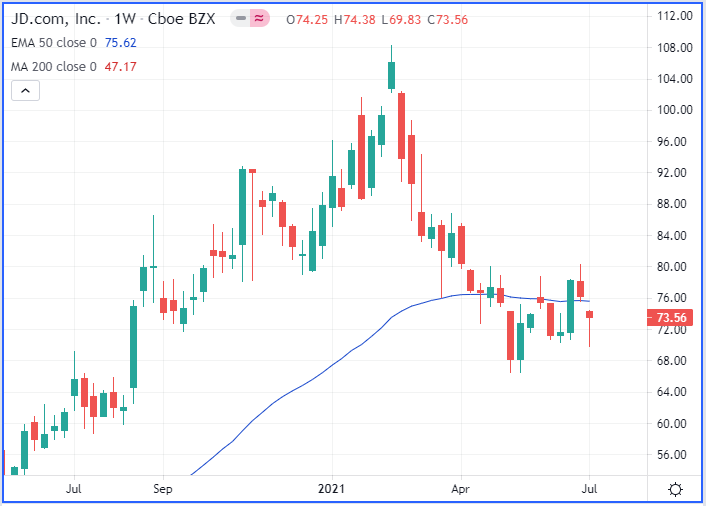
I really like playing JD from the long side now that the People’s Bank of China cut the bank reserve requirements.
JD is China’s No. 1 e-commerce retailer and will benefit from economic stimulus.
There is the added benefit of a hammer candlestick pattern in the chart above, which is typified by a long lower stem and short upper body.
Selling was shut down last week and JD is poised for a nice trend higher.
I am long two of the 72.5/77.5 call spreads to Aug. 20.
Bring It Home
Catching inflection points in the market technicals is crucial to putting yourself in a powerful position.
By that I mean placing yourself in a low risk/high reward trade that is easy to manage and offers a high probability of success.
The catbird’s seat, if you will.
I believe each trade I showed you today is that type of trade — with great potential to pay handsome dividends.
Live And Trade With Passion,
Griff