

BY BILL GRIFFO
July 21, 2023
Each week, I’ll give an overview of a stock and Licia Leslie will follow that up with a chart analysis the next day. Bill Griffo will chime in with macro analysis and Andrew Giovinazzi will then finish out the week with a volatility breakdown.
Have a stock YOU want us to review? Email my team here. – Mark
Hey Traders,
It took a historic NASDAQ 100 index special rebalancing to bring Microsoft Corp (Ticker: MSFT) down from nose bleed levels.
The stock is down 6% from the all-time new highs posted just this past Monday. The previous high was 351.47 on June 16.
MSFT’s NASDAQ 100 index weighting must decrease by 3%. This is no small feat.
Today, we’ll look at the implications for its price and where you should consider stepping in to buy.
There are two massive flows of selling pressure on MSFT this week:
- Selling needed to rebalance the NASDAQ 100, which amounts to $7.4bn in MSFT long positions which are liquidated to buy an equal amount spread across a basket of stocks whose weightings have been increased.
- Selling needed to rebalance option dealer’s delta-hedged JUL21 OpEx trading book. For example:
- As dealers sell investors MSFT call positions they sell calls and buy stock to delta hedge the short calls
- When the calls expire the dealers must sell their long stock positions.
The combination of the two will overwhelm the markets into next week. Let’s take a look at the charting pattern.
The MSFT weekly chart below reveals a reversal pattern as price made a new high, which was not confirmed by RSI, which made a lower high.
You can also see this week’s candle with the potential to signal either a bearish shooting star or gravestone doji pattern.
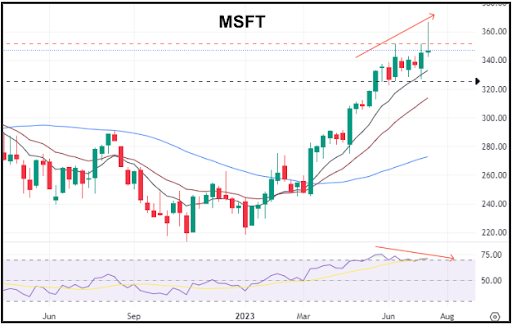
It is difficult to see a significant rally in the days ahead to get MSFT back on track.
There’s also a macro force at work that will weigh in mega cap tech stocks – higher interest rates.
US interest rates rose significantly yesterday, and if that continues it will put pressure on the tech sector, which includes interest rates as a key valuation metric.
Where is MSFT Likely to Go in the Days Ahead?
The daily chart below shows MSFT’s incredible uptrend:
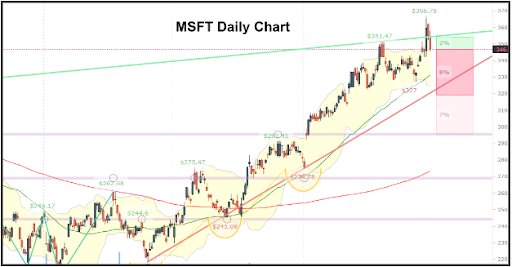
Notice the failed breakout above the top of its longer-term up channel. This is also a bearish sign.
However, if this sell-off is simply related to the forced selling from the rebalance and JUL21 OpEx then we could see a quick recovery in the weeks ahead and a resumption of its uptrend.
It would take a close below the 50-day MA and the uptrend at 320 before considering the rally to be over.
The Bottom Line
I would cover any bearish positions against the $340 level and look to get long against $330 with a tight sell stop on a close below $327.
Remember, Monthly expires have the tendency to set extremes in the market …
And with the rebalance happening at the same time, it’s a lot to overcome, but the market has shown incredible resilience.
If it holds $330 and builds momentum higher … jump back on the Microsoft AI bandwagon.
Questions about that? Leave a comment below!
Live and Trade With Passion My Friends,
Bill Griffo

