

Each week, I’ll give an overview of a stock and Licia Leslie will follow that up with a chart analysis the next day. Bill Griffo will chime in with macro analysis and Andrew Giovinazzi will then finish out the week with a volatility breakdown.
Have a stock YOU want us to review? Email my team here. – Mark
Hey Traders,
Looking at the SPDR Gold Shares ETF (Ticker: GLD) going back to March 2022, it traded a high of $193.30.
GLD traded straight down from there.
It created a double bottom in September and November trading a low of $150.60.
That was down 22% in six months.
The double bottom created the rally we are in now which so far has traded a high of $191.36 on May 4, 2023:
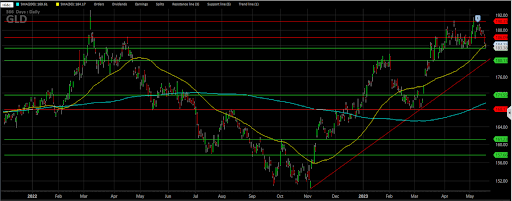
We are currently in a pullback trading $184.25.
But, in my opinion, not for long.
Taking a closer look at the chart, Wednesday’s candle traded right down to and bounced off my support level at $183.45:
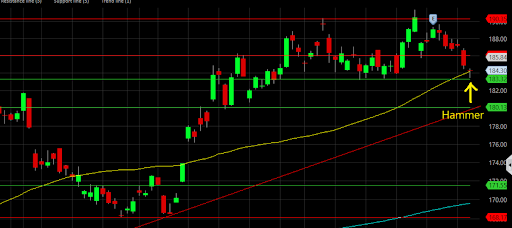
This coincides with the 50 day moving average (yellow line) providing support.
It has also created a hammer candlestick which could be signaling a change in this downtrend.
Looking at the Gold Futures June contract, it has traded down to my support level and looks to be forming a hammer there, also:
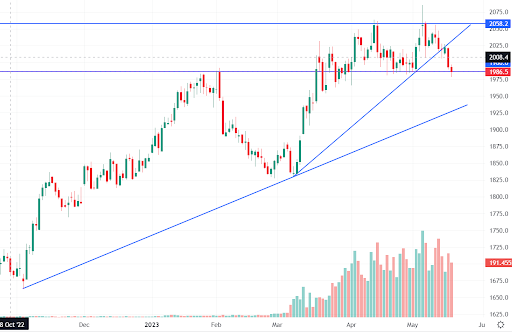
As with any change in trend Japanese candlestick, wait for the confirmation the following day before hopping in and a close above the 50 day.
Once you are long, use that 50 day moving average as your stop loss.
I think GLD can trade back up to $186.25 and then on to $190.35.
Trade accordingly,
Licia Leslie