

The Option Pit VIX Traffic Light Is Yellow: Volatility is likely to move wildly.
Hey Traders,
On Monday, S&P 500 managed to close up 3.52. Meanwhile, the VIX was able to hold onto some of the weekend effect to settle up .12.
Monday was a super inside day – when the daily price range stays inside the previous day’s range – that could be something to expect as we head into earnings.
Realized volatility has fallen off a cliff. Tthe market is simply not moving and that is pushing the VIX lower.
I'll dig into why this is going to change in my next post … because today I want to talk about the newest VIX index that just listed…
Cboe 1-Day Volatility Index (VIX1D)
The 1 day VIX is an index that measures options with one day to expire.
To do this calculation it actually measures the implied volatility on two sets of options: zero days to expiration (0DTE) and 1 DTE.
0DTE options expire at the end of the day.
1DTE options expire at the end of the next business day.
At the exact time the bell rings in the morning, the index puts a lot of weight on 0DTE. Then as the minutes pass, more and more emphasis is placed on options that expire the next day.
As the day progresses, all other things being equal, I would expect the index to gradually increase as the net duration of the options it is calculating moves from 6.5 hours and 30.5 hours to 24 hours.
There will literally be a daily reverse weekend effect in this index as options that have gap risk become a bigger part of the equation and options that do not come out of the index.
Monday being an inside day is a good example of how the index can move on a normal day:

Understanding how the index is going to move on a daily basis when all else is generally equal is important … because when it breaks that trend we have something cooking.
While the sample size is obviously small (one day), let’s look at how SPX and VIX1D moved together on Monday
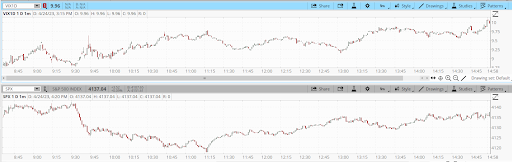
SPX is on the bottom, VIX1D on the top.
What interests me the most is the wick on the VIX1D just before 9:45 CT.
While that was not the bottom of the market, that was a clear sign that the surge in selling was over.
From a trading perspective on a small sample size on a very inside day, that is useful.
What that would potentially tell me is that if and when we see a rally that breaks the pattern of lower highs and lower lows … I should believe it if volatility will not spike again.
The general lull the rest of the day in hindsight also tipped me off that we were nowhere.
But what if the index really takes off? It could be very useful for spotting local highs and local lows.
I would note that around 11:30 CT, VIX1D was lower than it had been in the middle of that nasty sell off around 9:35.
Again potentially another signal.
Now what about people that do not want to day trade.
Watch how the index moves against VIX.
When the index breaks above VIX itself, we are in the middle of something bad and it could continue into the next day.
It is legitimately a sign to close short options.
I need to watch this index more, but these are my first day takeaways. Much like the first week of baseball season, I’m sure I will learn more about this index.
And I’ll share it here first.
Questions about that? Comment below!
Your Only Option,
Mark Sebastian