

Each week, I’ll give an overview of a stock and Licia Leslie will follow that up with a chart analysis the next day. Bill Griffo will chime in with macro analysis and Andrew Giovinazzi will then finish out the week with a volatility breakdown.
Have a stock YOU want us to review? Email my team here. – Mark
Hey Traders,
Unlike Mark, I have always preferred Bud over Miller.
Although, my first choice beer would always be something more substantial like a Stella or my favorite from the Chicago brewery Revolution and their Anti Hero IPA.
Yummm.
Bud does make a good seltzer.
On to the charting before I get too thirsty.
Remember, when you are analyzing a stock chart, you want to go back in time to find any patterns.
Those patterns are support and resistance levels and trend lines where the stock will revisit the line and then bounce off of or roll over at these points or completely bust through.
Looking back on the Anheuser Busch Inbev (Ticker: BUD) stock chart, it has traded down to a support level that goes back to 2010:
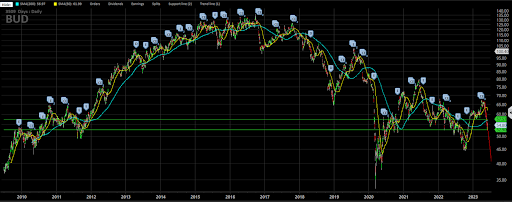
That is a pretty substantial support level to go back that far.
BUD has traded below here and most recently traded down to $44.50 just last October.
Zooming in on the chart, BUD looks like it is trying to rally here.
You will encounter some resistance at the 200 day moving average (turquoise line) at $57 and my old support / new resistance level at $57.65.
Beyond that my next resistance level comes in at $62 which lines up with the 50 day moving average (yellow line).
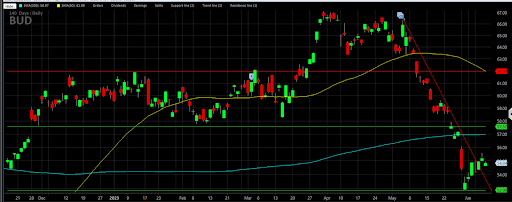
I like BUD here for a longer term buy.
Use $53 as your stop loss on the downside.
Trade accordingly!
Thanks For Reading … See You Next Tuesday,
Licia Leslie