Hi Shoppers,
Even though Friday felt pretty bullish, there is a key support level we need to watch in the S&P 500 Index (Ticker: SPX).
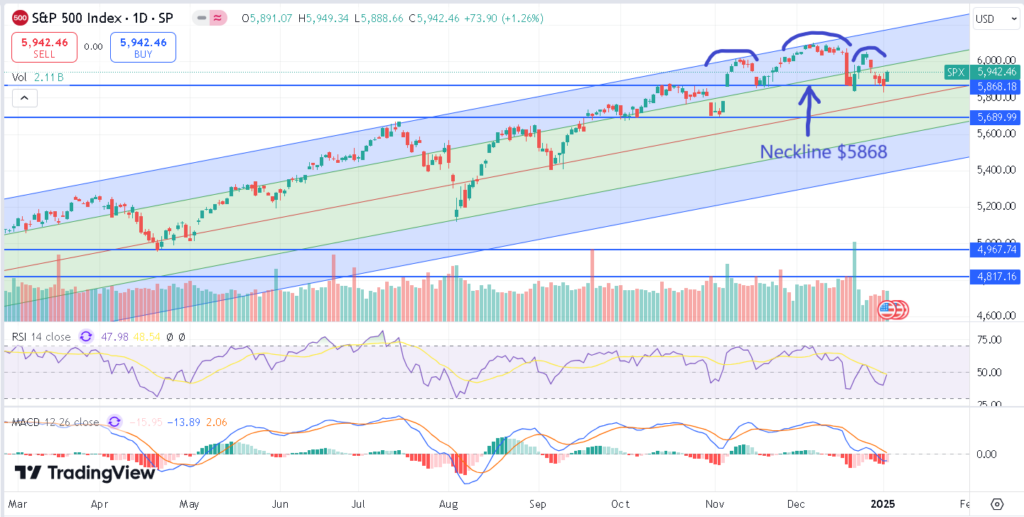
There is a possible head and shoulders pattern developing in the SPX which could be denoting the top is in and we may sell off.
SPX honored the top resistance of my pitchfork when it ticked its high of $6099.97 on December 6th and pulled back.
Here it is on the chart:
Now in order for this pattern to come to fruition, we need confirmation which will be a close below the neckline at $5868.
If this happens the target price is the high less the neckline subtracted from the neckline.
In this case 6100 – 5868 = 232 and then 5868 – 232 = 5636.
Now, I do realize I talked about this as a possibility in Nvidia (Ticker: NVDA) back on December 18th and it did not pan out.
In fact NVDA is looking pretty bullish here.
But it is something we need to be aware of and watch that neckline support level at $5868.
Trade accordingly.
And here’s the link again for the Small Account Challenge.
Thank You For Reading … See You Next Tuesday,
Licia Leslie