Head and Shoulders Bottom in IWM

Licia Leslie

Licia Leslie

Licia Leslie

BY LICIA LESLIE 

November 15, 2023 

That was a face ripper, right?


S&P 500 (Ticker: SPX) gapped open 47 points and never looked back.


The high was $4508, up 97 points!


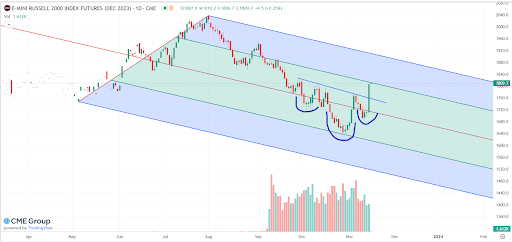
Check out this bottom forming pattern in the Emini Russell 2000 Index:

See that? It is a head shoulders pattern signaling the bottom of the selloff.


And it has definitively broken the neckline.


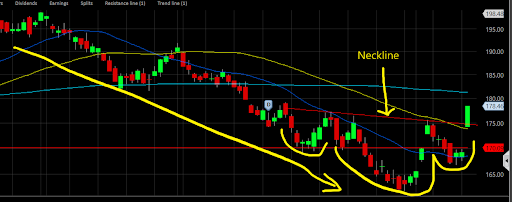
Here it is on the IWM chart:

According to the rule, IWM will rally up to $190.


That is the difference between the head (low) and the neckline, add to the neckline.


We will have some resistance coming in at the 200 day moving average at $181.29.


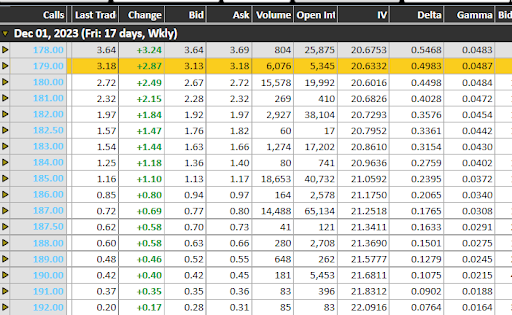
I am shopping the Dec01 calls:

I like the 179/189 call vertical for $2.60 or less.


Use a close below the neckline, $175, for your stop loss.


Trade Review


As I said above, the S&P 500 Mini Options (Ticker: XSP) trade was a homerun up over 100%.


Join us live for more trade ideas by becoming an Option Shopper.


Thanks for Reading … See You Next Tuesday,


Licia Leslie

Licia Leslie

Head of Technical Analysis

pit profits

See what's hot at option pit

CAPITOL GAINS: SMR Aug16 7 call closed for a 150% gain

DELTA STRIKE: VLY Mar15 8 puts closed for a 88% gain

PFE May17 26 calls closed for a 66% win

OP MENTORING: SPY Mar22/19 510 put calendars and 520 calls for 6.4% gain

OPTION SHOPPER: ERX Mar28 65 calls closed for a 90% gain

Licia Leslie

Licia Leslie

Share This Article

About the Author

Licia Leslie

Licia Leslie

Former CBOE floor trader and CIO at Karman Line Capital. Author of ‘The Option Traders Hedge Fund’ with over 30 years of options trading experience.

Popular Posts

Categories

Stay Updated

Subscribe to our newsletter for daily trading insights

Upcoming Events

FOMC Meeting

2:00 PM EST

Earnings Season Begins

Pre-market

Options Expiration

Market Close

NFP Report

8:30 AM EST