

Hi Shoppers,
So here is the chart with the double top and a doji:
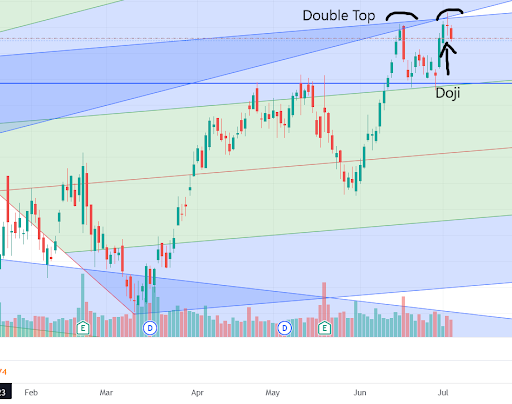
Are you able to guess the stock?
That’s pretty difficult when I haven’t even given you the price.
This is the Walmart (Ticker: WMT) stock chart.
It closed at $157.11 yesterday creating the confirmation needed to support that change in trend doji created on Wednesday.
The stock is also trading at the top of my pitchfork which usually denotes a pull back, also.
I think WMT will trade down to $154 from here.
Trade Review
I last talked about a rollover in Apple (Ticker: AAPL) and it trading down to $187. It has traded as low as $189.28 and I think it will still touch $187 before bouncing back.
In my opinion, Bitcoin (Ticker: BTCUSD) is still consolidating. A close below $30,000 will destroy my bullish theory.
Thanks for Reading … See You Next Tuesday,
Licia Leslie