

Hey Shoppers,
Wow! What a rally!
It felt like such a huge rally because intraday they tested all the weak hands.
The S&P 500 (Ticker: SPX) was up $45 before it sold off to up only $4.00, then proceeded to take off for the rest of the day closing up $39.
If you were in any of my live presentations, you would have heard me say, for the last week and a half:
“Watch the ES chart. I think it is consolidating, getting ready for a leg higher. As long as ES closes over $4120, the chart stays intact.”
Here’s that chart, the E-Mini S&P 500 June Contract Futures (Ticker: ES) daily chart:
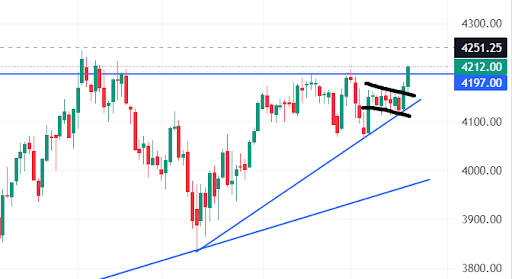
That consolidation is called a bull flag.
It is found at the top of a bullish green candle.
The stock is taking a breather, a pause, getting geared up for its next leg higher creating that flag.
It broke out of that range on Wednesday and traded much higher yesterday.
Can we go higher from here?
Let’s take a look at the S&P 500 (Ticker: SPX) daily chart.
Here is my pitchfork:
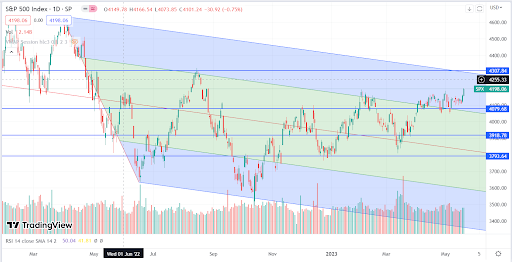
According to the pitchfork, the top resistance level comes in at $4297 and lines up nicely with the previous high made on August 16, 2022.
There may be some resistance before that at $4225.
Using the cup and handle pattern that high could go to $4080 (rim of the cup) – $3800 (base of the cup) = $280, $4080 + $280 = $4360.
And, of course, there could be a pullback from this $4200 level.
Support comes in at $4170 and $4105.
Watch for that change in trend daily Japanese candle at the top of this uptrend for a signal of a pullback.
That would be a doji, shooting star or hanging man candle.
Don’t know your candles?
You need to join Option Shopper.
Trade Review
I hope you were able to hop into those Newmont Mining (Ticker: NEM) puts.
Stock traded down $2.25 and those puts doubled in two days.
Thanks for Reading … See You Next Tuesday,
Licia Leslie