

Each week, I’ll give an overview of a stock and Licia Leslie will follow that up with a chart analysis the next day. Bill Griffo will chime in with macro analysis and Andrew Giovinazzi will then finish out the week with a volatility breakdown.
Have a stock YOU want us to review? Email my team here. – Mark
Hey Traders,
Fifth Third Bancorp (Ticker: FITB) is a victim of the recent banking crisis.
FITB has more than halved, coming down from $50 in January 2022 to just above $22 on March 13, 2023.
It has since bounced back to $28 and last week revisited $22.50.
This is the price FITB was trading at in December of 2020.
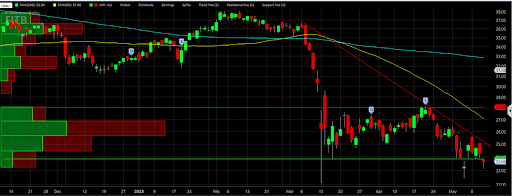
Looking at the chart, I have support coming in at $23.80:
This amazingly coincides with support on my pitchfork:
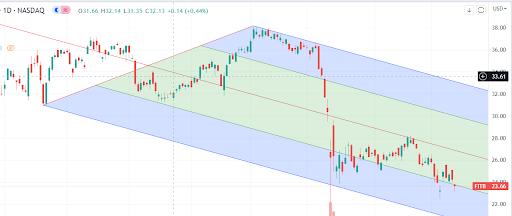
FITB is currently trading just under that support.
Not by much, but it did close $23.68.
I will be watching in which direction FITB lands on either side of that $22.85 level which could actually flip to become the new resistance.
Look to the left at the volume profile and it is wide open for FITB to trade lower.
I need a bit more evidence as FITB moves away from that $22.85 area to decide on whether calls or puts are in order.
On the upside, the resistance level comes in at $25.25 and the next support level is at $22.45 and then $22.
Trade accordingly!
Thanks For Reading … See You Next Tuesday
Licia Leslie