

Hey Income Hunters,
Last week’s Fed meeting, payroll’s number and regional bank’s market gyrations have shifted the market narrative.
Do not put any faith in economic numbers – they are packed with revisions and distortions meant to confuse you and get you off-sides.
The regional banking crisis will most likely moderate for a while, driven by the large Wall Street banks who have their own agenda.
You see, Wall Street and their dealer desks are creating conditions ideal for a melt-up scenario in the near-term, prior to a massive deflationary spiral in the second half of the year.
Today, I’ll share why Gold is the key signpost for knowing the melt-up is on motion and when to jump on board.
The Melt-up Conditions are in Place
It’s critical to stay focused on two conditions in the markets:
-
-
- Record short positions in stocks and bonds
- 5 trillion dollars sitting on the sidelines
-
Using FOMO to Their Advantage
Wall Street can use its powerful money flow to create the fear-of-missing-out (FOMO), which gets retail to buy the highs and sell the lows …
They can create the FOMO market scenario because of their deep understanding of market cycles … plus the power of setting the false narrative (trader psychology).
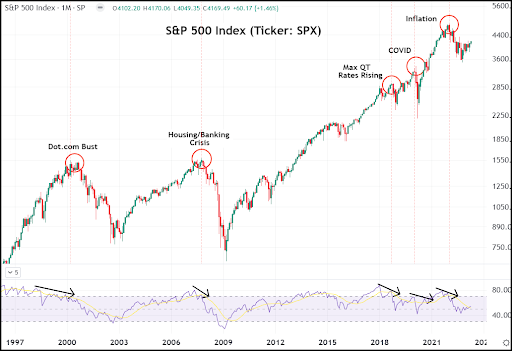
Notice the monthly S&P 500 chart below, and specifically inflation …
A blow-off top from a 40-year bull market does not reverse on an inflation breakout. Long-term cycles usually end on a deflationary collapse that sends the market into a 10-year consolidation.
Banks completely understand this logic because they have a window to the inner workings of the economy.
They can sense when the financial system is on the verge of a collapse.
When they believe it is, they will manipulate data and prices so they can rebalance their books in time to make all the money as investors and traders get run over.
Gold is the Key Signpost
The Banks have so far helped the Fed maintain stability in the markets by selling paper gold, i.e. SPDR Gold Trust ETF (Ticker: GLD).
The large banks, mainly JP Morgan (Ticker: JPM), create massive amounts of paper GLD and sell into the market to suppress the price of gold, thereby boosting the price of the US Dollar.
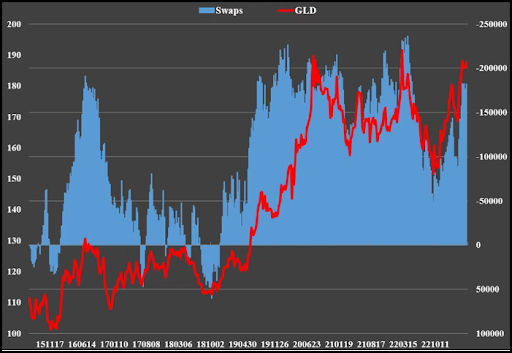
However, there has been a change in their management of this position. They have pulled back from their past aggression in engineering the downtrends in GLD.
Notice the GLD (red line) chart below with an overlay of bank positioning (Swaps).
The bank positioning (blue histogram) is inverted on the right access and shows a short positioning in GLD but not near as high as it has been in the past.
The banks understand how powerful the GLD fundamentals are and are just trying to keep the gold rally in check.
They’re buying time while they build the foundation for the melt-up in stocks and bonds. Once they engineer the FOMO rally, they will turn around and also become buyers of gold.
What’s the Trade
In the short-term, the gold pattern shows multiple negative divergences. Notice the higher highs in price with lower highs in relative strength. This is a very reliable reversal signal.
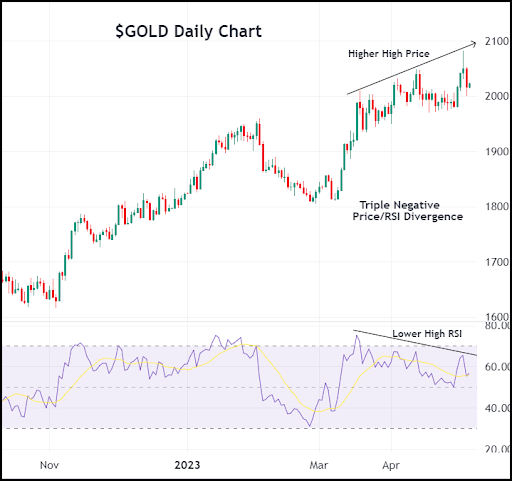
Look for a short-term pullback in gold to 1990 and maybe 1950 to buy before it turns back up and ultimately breaks above 2089.
The fundamentals are so strong – collapse in dollar, Fed pivot to QE, central bank buying, etc. that it may break above 2089 regardless, so be prepared to buy the breakout also.
In the meantime …
Live and Trade With Passion My Friend,
Griff