BY MARK SEBASTIAN
June 17, 2024
S&P 500 Emini Futures (TIcker: ES) and SPX
The S&P 500 has certainly been on a run.
Over the past 3.5 years, the index is up over 43%.
To compare, the Russell 2000 (a small, mid cap stock benchmark) is up just 4% over the same time period.
The correlation between the two indices has been steadily decreasing and the disparity in returns widening.
If large-cap companies continue to demonstrate strong earnings growth and resilience, the divergence might continue.
But one thing that I’ve learned in my decades on Wall Street is that sectors shift and markets often revert to their means.
That could mean that small cap stocks catch up to their larger cousins through increased performance.
It could also mean that larger caps catch “up” through underperformance.
The divergence is setting up for a move!
ES and SPX: Conflicting Charts
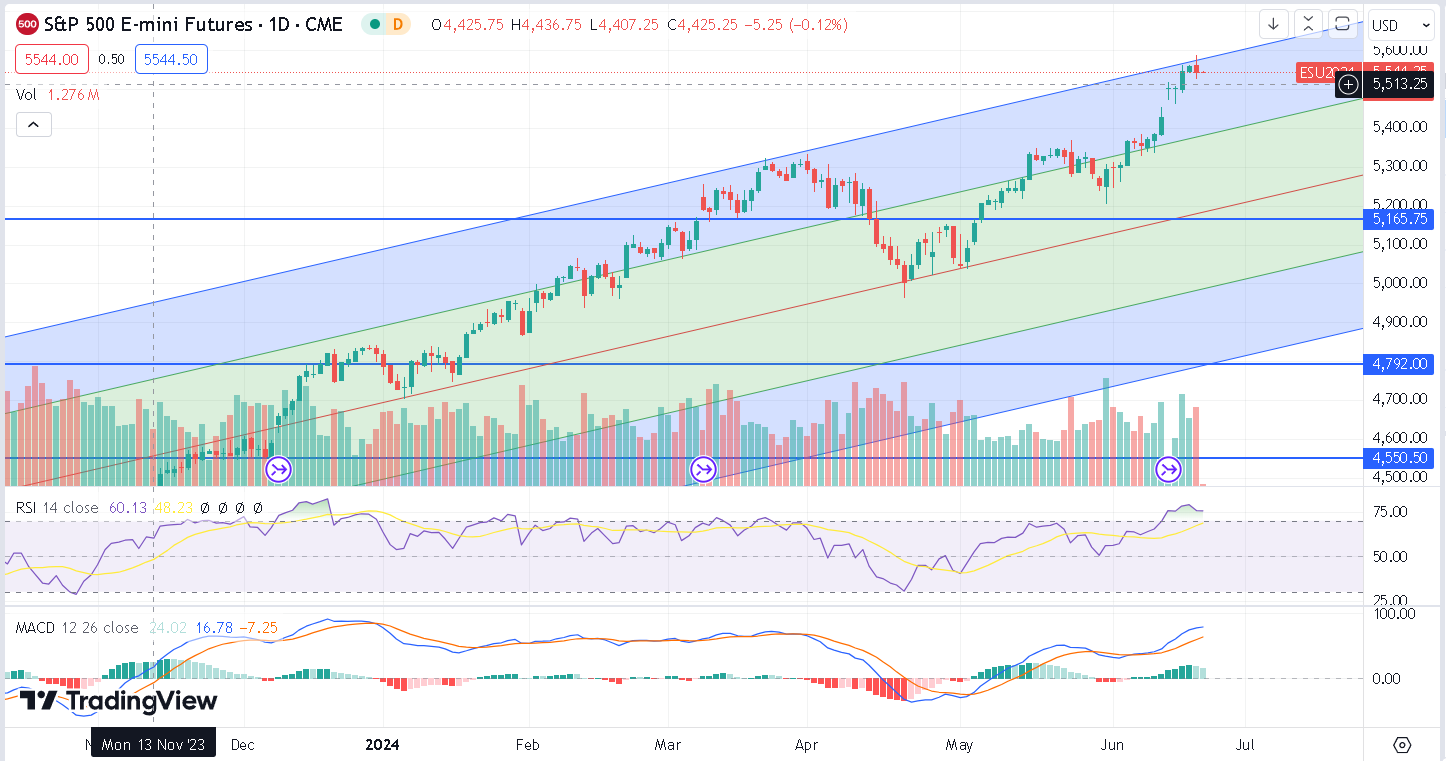
The S&P 500 Emini Futures (TIcker: ES) has traded right up to the top of the pitchfork and yesterday’s action has created a doji candle which signals a change in the trend:
If yesterday’s low holds, this will create a bull flag and we will take another leg higher.
If we open and trade lower, the doji comes to fruition.
A pullback would take it back down to $5462 and then $5388.
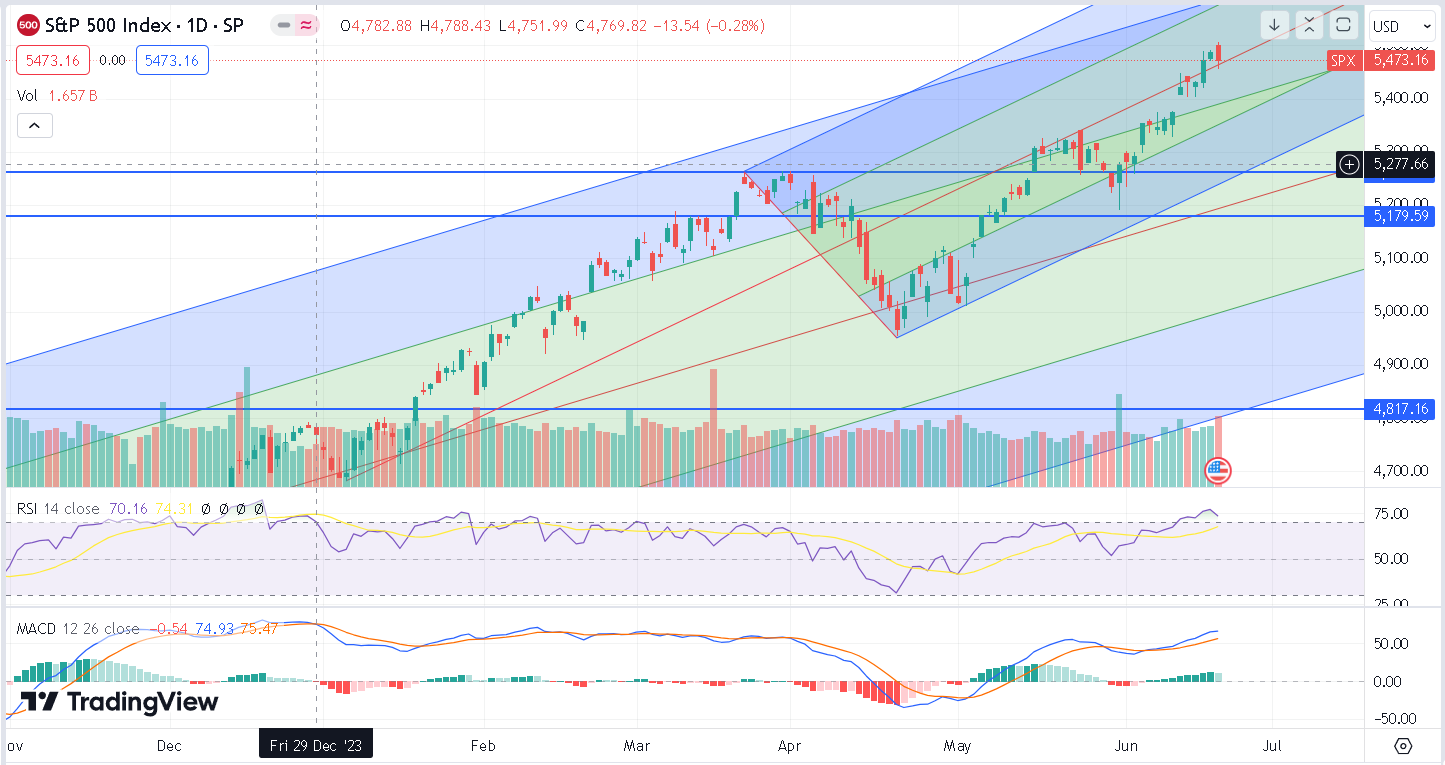
The S&P 500 Index (Ticker: SPX) does a have bearish engulfing candle created yesterday, but it did bounce off the median line support on yesterday’s lows:
Good size volume on the day supports this bearish action.
Support for today sits at $5472 and below there down at $5405.
Throw in the QQQ and NVDA charts and odds are we are heading a bit lower.
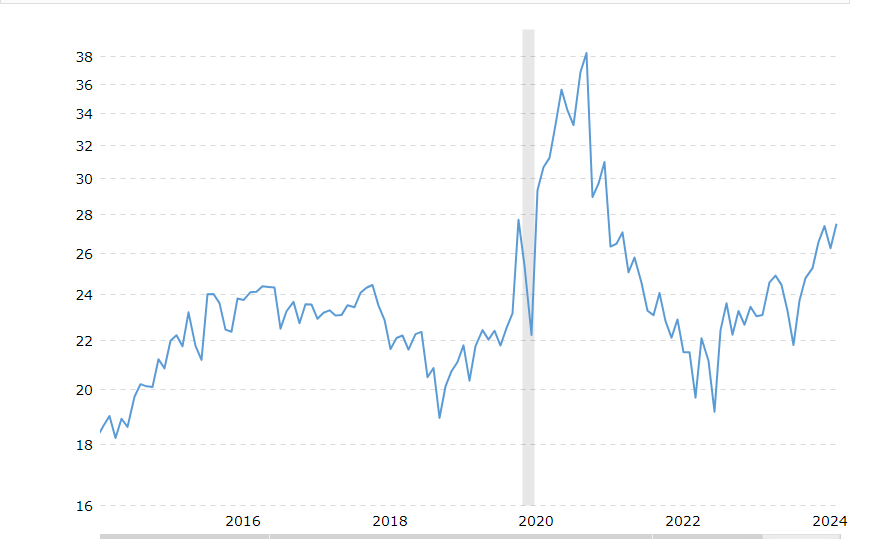
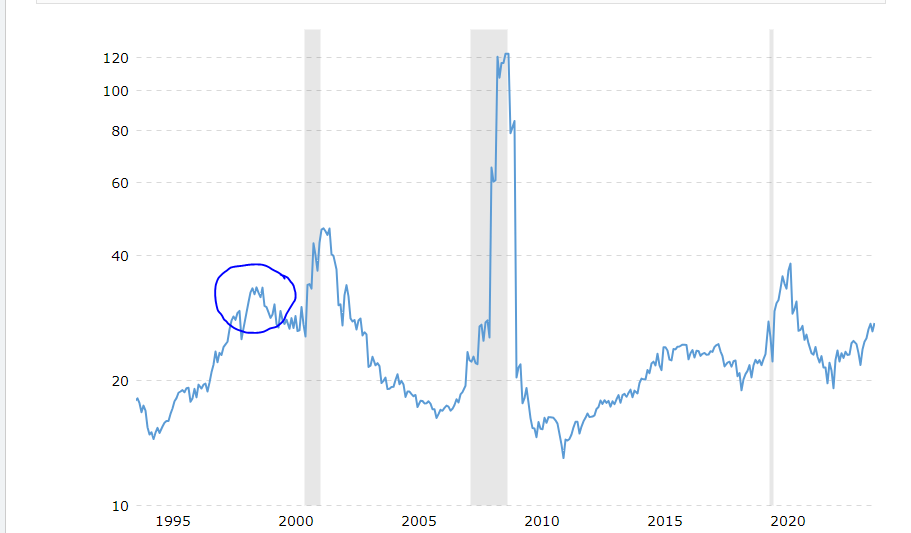
This is a 10 year chart of the trailing twelve months Price Earnings ratio of the S&P 500. I would invite you to throw out 2020 because the lock downs completely messed up the data.
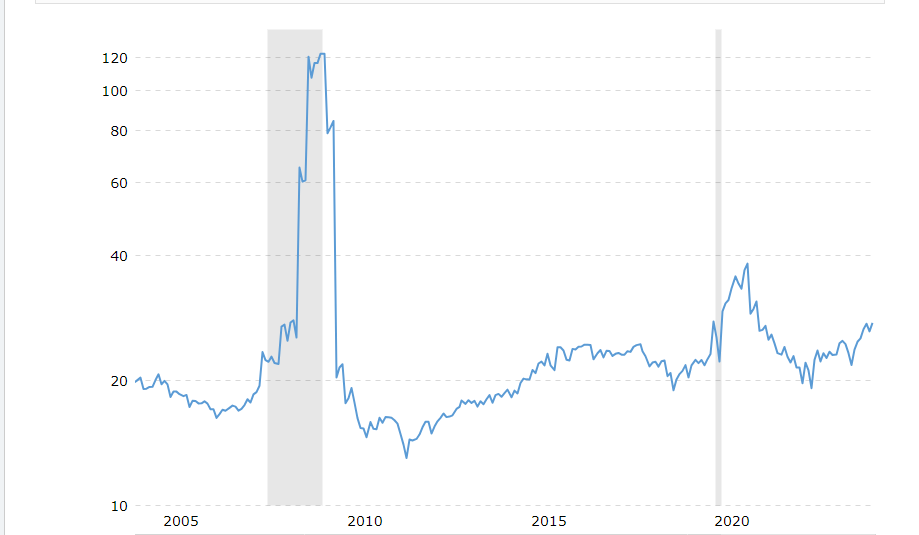
But outside of that…all the data is normal. Covid aside the S&P 500 is at its highest trailing PE in the last 10 years…Here is 20
Again, we saw inflated PE’s into the great recession…but out side of that the PE stays around 20-25.
Take a look at 1998-1999:
This is the last time we weren’t in a recession and the PE was this high….these PE’s can go higher if people are that frothy…like we were doing the dotcom boom.
Things are stretched….but they could stretch further…I am not long…but I am not short…yet.
But when I do go short…and I will. I will be going much larger than my normal size…Ill be doubling down.
Just like we do in 0DTE when the double down meter is within our criteria….what is the double down meter? Check out the replay from my presentation I did with Hannah on Thursday…watch it here.
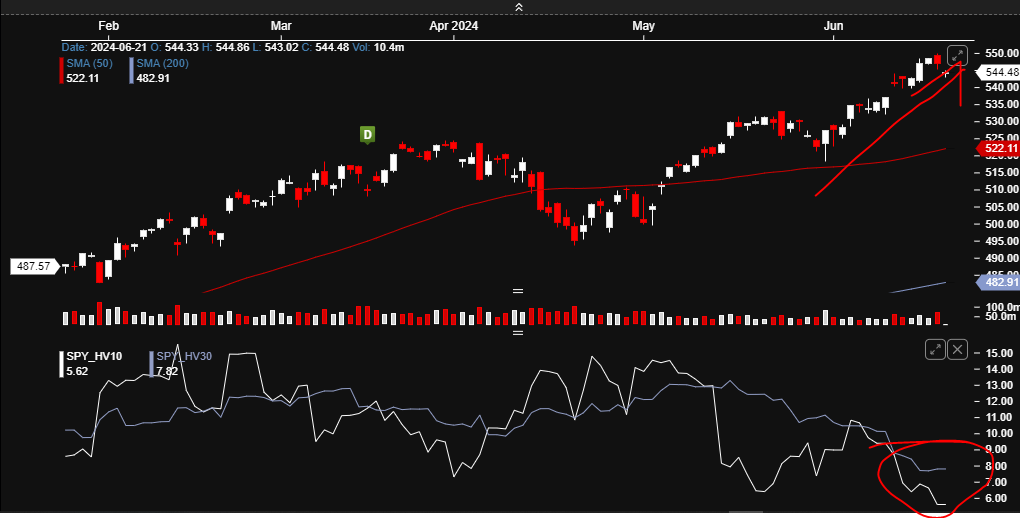
The volatility chart you need is right below. Realized volatility in SPY is dirt cheap because the market just goes up a bit each day and only backs of a little bit every day. Just ride a bull market with cheap protection.
6 month chart of SPY with 10 and 30 day realized vol
The trick is buying a little more duration.
I like the options 30-60 days out and nearer the money, within the straddle. The reason is:
If SPY keeps the same vol pattern, the calls with pay.
If SPY brakes the vol pattern, we are 500 again SPY and the puts will pay.