BY MARK SEBASTIAN
September 20, 2024
Let’s hone in on what happened to TLT during the last rate cut cycle.
That cycle began in August of 2019 when the FOMC dropped rates .25 BP on August 1st and began cutting every meeting.
Then when the COVID-19 Panic hit, they began more aggressively cutting rates by .50 to before a full 1 point cut on March 16.
How did TLT do in that time?
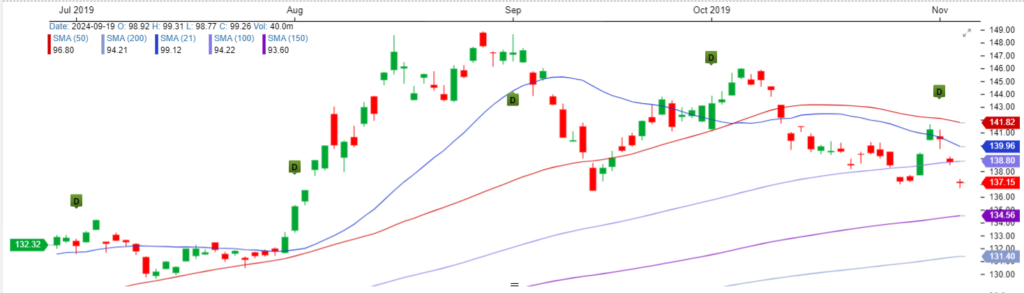
TLT expanded rapidly growing from about 131 in July of 2019 to topping out at 172 in April (ignoring the panic spike from March).
Part of this was derived from the Covid fear, but I think it is worth looking more closely at the July-November time period.
Without a panic but knowing the FOMC was going to be gradually cutting rates we saw TLT move from 132 up to 149.
If the percentage holds true, we should see TLT up more than 10% by November of this year … assuming inflation does not return and the Fed keeps indicating cuts.
It’s probably a near term buy … but I’d like Licia’s look at it of course.
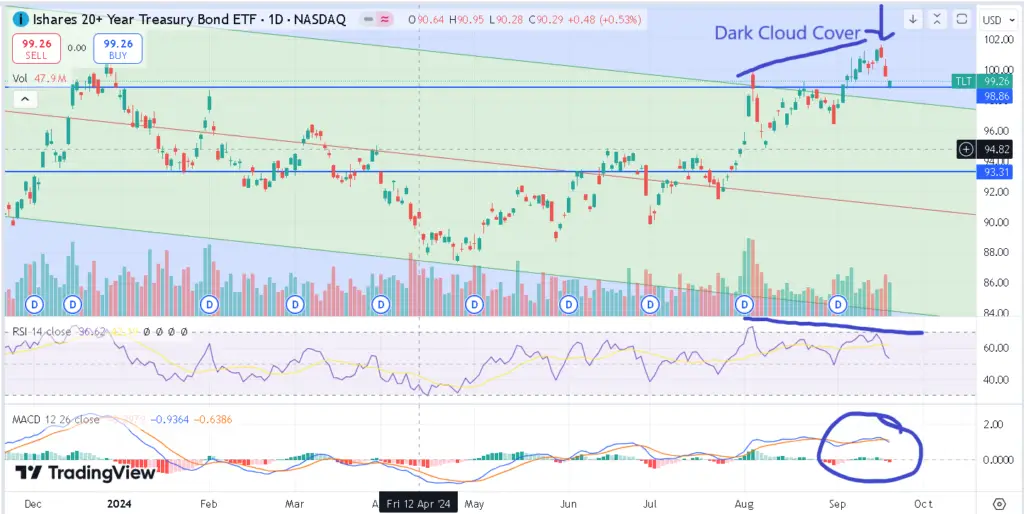
The iShares 20+ Year Treasury Bond ETF (Ticker: TLT) has been rallying since it bounced off my pitchfork support back on April 25, 2024:
That low was $87.34.
The most recent high on September 17, 2024 was at $101.64.
The candle created that day stopped the rally.
It is a Dark Cloud Cover candle and occurs when a high is taken out and the price reverses and closes at least half way down into the previous session’s bullish green candle.
This is a change in trend candle.
Thursday TLT traded down to my support at $98.86 and closed higher.
The MACD did just roll bearish on Wednesday so keep an eye on that.
There is also a bearish divergence on the Relative Strength Index meaning the stock traded higher and the RSI went lower.
If this support holds, TLT will trade back up to those previous highs and then possibly $104.
Violating this support brings TLT down to $96.45 and then $93.31.
With the rate cut announced I wouldn’t be surprised if TLT just consolidates here for a while before making its next move.
Bond Vol says Steady Jerome
So we got the half point cut in interest rates this week as Jerome did what the market wanted and cut by ½ % point. I was surprised but that did not stop Congress passing a spending bill with no spending cuts. I wonder if those dopes understand their Milton Friedman; who btw is the greatest 20th economist by far.
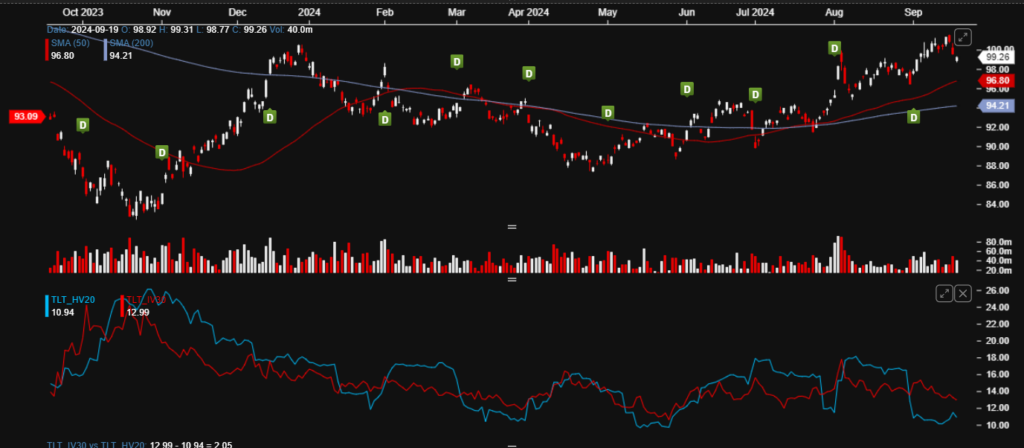
What the cut does signify is a change in tone and increase in certainty, as certain as the market can be, in the direction of rates and bond prices. See the red line in the chart below. Short term implied volatility (IV) is rolling down even with the little dip in TLT prices.
1 year TLT with IV30 as the red line, 20 day realized volatility in blue
Note also that realized volatility is near the bottom of the range for the year. That is not the stuff of massive change in sentiment, rather a confirmation of trend. The market was looking for cuts and got them with inflation around 2.5%.
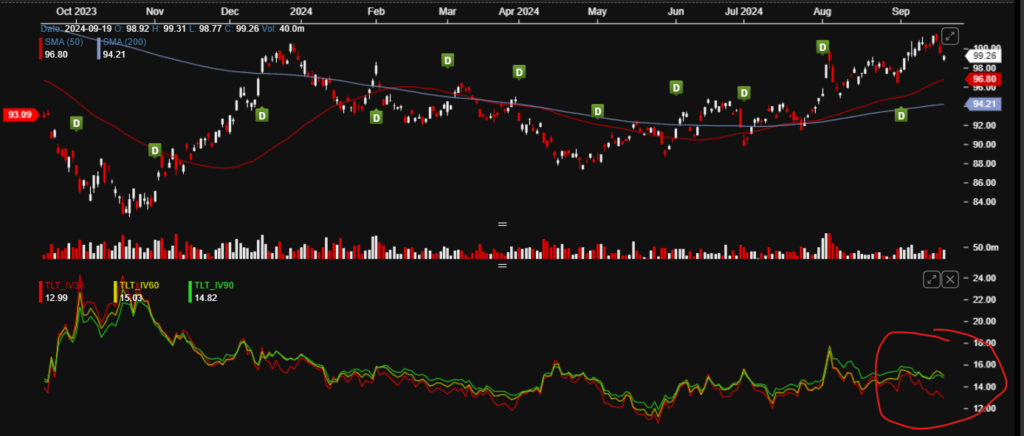
Below I highlight 30, 60 and 90 day IVs. Note the “contango” forming as short term IV drops to the floor relative to longer term IVs. That is a benign volatility signal, likely looking for much less short term volatility in TLT and like just slowly bullish.
1 year TLT with IV30 as the red line, 60 in yellow and 90 green
That leaves us with less volatility and likely more upside or following the longer uptrend since mid-May. With the big decision out and IV lower, volatility says to lean long TLT.