Each week, I’ll give an overview of a stock and Licia Leslie will follow that up with a chart analysis the next day. Bill Griffo will chime in with macro analysis and Andrew Giovinazzi will then finish out the week with a volatility breakdown.
Have a stock YOU want us to review? Email my team here. – Mark
Hey Trader,
Our Pit Report trades have been going well. Check out my trade update list here.
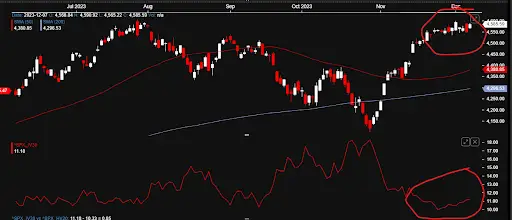
I cannot rest on my laurels and it has taken a little bit of management except for the SPDR S&P 500 Trust (Ticker: SPDR) which flew to the moon this past week.
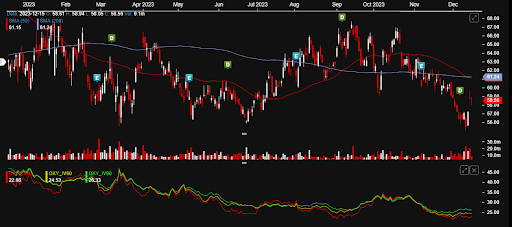
Occidental Petroleum Corp (Ticker: OXY) has been more like the lunar module crashing to the surface.
The recent big moves up from year lows are certainly in keeping with the market. The question is does the implied volatility price this correctly?
Enquiring Minds Want to Know!
Implied volatility is way to low
One of the better ways to read a vol chart is with the stock chart right next to it. That way the move in IV is in context with the move in the underlying. Right now, the IV SIGMAs, vol per term, are in contango so the farther terms are more expensive than the shorter terms. Note that when sigmas were around the same, OXY was much more volatile.