Hey Traders,
Last week was certainly a wild one, fueled by hawkish comments from the Fed, and exacerbated by the Quadruple Witching on Friday (where U.S. options and futures all expire simultaneously – including $818 billion in single stock options).
But while we definitely saw some increased volatility through Friday’s close, reflecting back on the trading week reinforces that all indexes are not created equal.
Rather, we saw some varied market movement, which tells me a couple of things.
Let’s take a deeper look at what we saw last week …
First and foremost, the Dow Jones Industrial Average (DJIA) – an index that measures the 30 largest publicly traded companies in the U.S. – took it squarely on the chin last week, falling 1,189 points, or 3.4%.
It was the index’s worst week since October, as investors were spooked by the potential of tightening monetary policies being put into place sooner than expected.
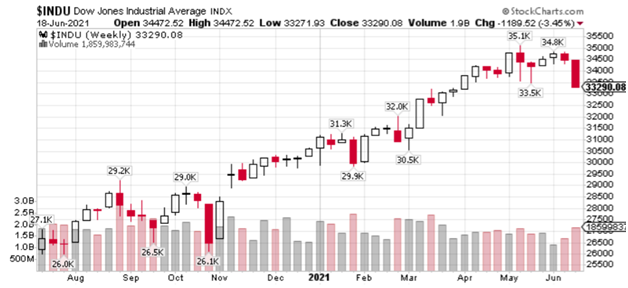
Chart courtesy StockCharts
Meanwhile the Russell 2000 (RUT) – which consists of 2,000 small-cap stocks – also had a rough go. The small cap index dropped 99 points, or nearly 4.3%. However, this could be partially due to investors looking ahead to next Friday, when RUT will undergo its annual rebalancing (we’ll take a closer look at what that means later this week).
The S&P 500 (SPX) proved a bit more resilient. The SPX looks at the 500 largest publicly traded companies in the U.S., and only suffered a weekly loss of about 1.9%, or 81 points.
While that certainly wasn’t a preferable way to end the week, the fact of the matter is the SPX is still not that far off its recent all-time highs, although a breach of its 50-day moving average does have some investors side eyeing the index.
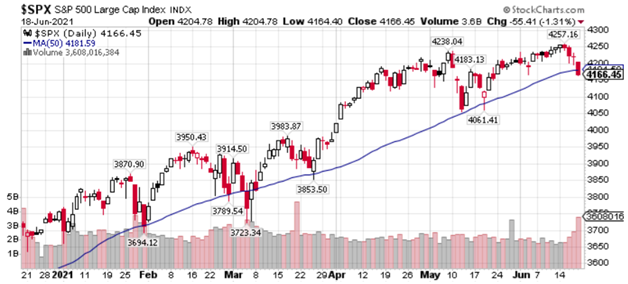
Chart courtesy StockCharts
However, let’s take a look at the Invesco S&P 500 Equal Weight ETF (RSP), which tracks the S&P 500, but weights the influence of each equity differently. As opposed to the market weighted S&P 500, which weighs each stock in proportion to its market capitalization, the RSP is an equal weighted ETF. This means the RSP weights each of the 500 components of the S&P 500 equally, so companies with larger market caps don’t exert outsized influence over the index as a whole.
The RSP fell 5.5 points, which equates to a 3.6% overall weekly decline. Friday was especially rough for the RSP.
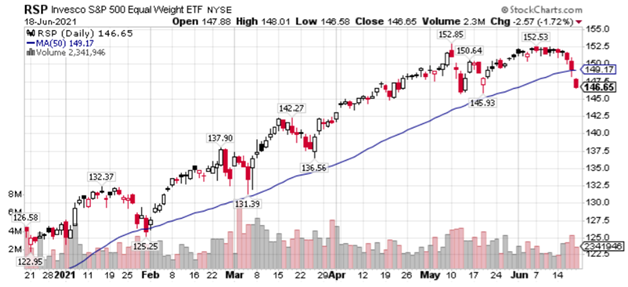
Chart courtesy StockCharts
RSP may prove to be an important index to watch over the next week, as it is headed towards a rebalancing on Sunday (and again, we’ll talk more about that later this week).
It wasn’t all bad news on the market. The Nasdaq 100 (NDX), which looks at 100 of the largest non-financial Nasdaq components, actually finished higher for the week, up 0.3%. Given that financials was one of the hardest-hit sectors this week, it makes sense that the NDX was able to insulate itself from some of the Fed-sparked pullback.
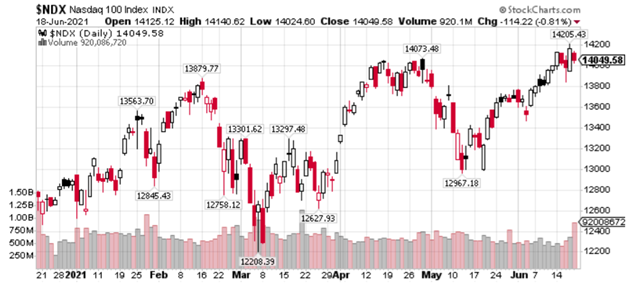
Chart courtesy StockCharts
The Nasdaq Composite itself only fell 0.3% for the week. Keep in mind, though, this doesn’t necessarily point to an inherent strength in the Nasdaq – rather, the index has already been underperforming the S&P 500 as of late, as investors have chosen to reallocate away from tech stocks.
Surprisingly, gold was also down on the week. Typically, gold prices increase during a market sell-off, as investors scramble to switch over to the precious metal ‘safe haven.’ But the Fed’s signal that it could boost interest rates as soon as 2022 weighed on gold prices, which are a “non-yielding” asset. Both higher interest rates and the resulting higher dollar tend to pressure gold prices lower.
However, as Option Pit’s Commodities Expert Bill Griffo has been warning us about, new regulations concerning gold and gold derivatives go into effect just one week from today. He went live with a warning about the effects of this regulatory change earlier this month (you can watch it here). As $40 billion of gold derivatives are forced to unwind, we could see immense pressure on the US dollar, and a huge boost for gold prices. He’ll be going live again this week to discuss what he’s seeing, so keep an eye out for your invitation – or subscribe to his Power Income newsletter to stay in the know.
Perhaps unsurprisingly, the Cboe Volatility Index (VIX) ended the week on a high note. The “fear gauge” had been slowly creeping higher all week, and finally tapped above 20 for the first time since May 24, confirming that the Fed has indeed struck some fear into the hearts of investors.
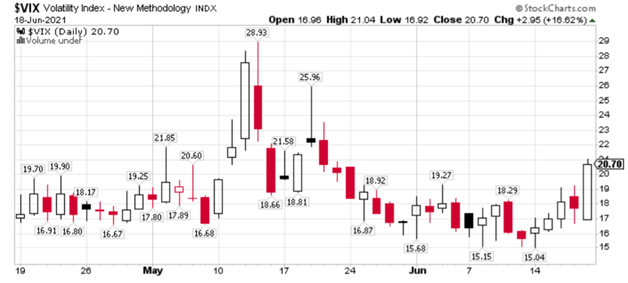
Chart courtesy StockCharts
The varied reactions of different indices indicates to me that this latest market turbulence may not necessarily indicate weakness, so much as just undermined investor confidence.
This week will give us a better idea of what’s to come in the weeks ahead, as (hopefully) the market shakes off J-Pow’s hawkishness, and continues to charge ahead.
Your Only Option,
Mark Sebastian