

BY MARK SEBASTIAN
December 21, 2023
Each week, my team will give an overview of a stock. I’ll discuss fundamentals, Licia will analyze the charts, and AG will break down the volatility.
Have a stock YOU want us to review? Email my team here. – Mark
Hey Trader,
This week’s stock is a lithium name. All our Option Pit traders are here to break it down. It’s probably the premium lithium name in the space. That’s right – we are looking at
Albemarle Corp (Ticker: ALB).

Fundamentally, this is a company that makes a LOT of money… They make money in Lithium…but they also have other profitable businesses like Bromine and Fire prevention and extinguishing.
ALB produces a huge cash flow of 17.54 per share, which leads to even greater earnings….a whopping 28.20 per share.
It pays a sizable dividend of 1.99 a share.
With a valuation of 17.4 billion, ALB has a PE of just 5.28…that is cheap.
If there is a downside to ALB it is that its long term debt load has been growing and now stands at 3.5 billion dollars…
Even so it has a healthy debt to equity ratio of .34….that is a comfortable level.
My take, from a long term buy and hold perspective, if you want to play in the lithium space…this is the company to buy. It is the cream of the crop.
In terms of the short term trade…
I’ll leave that to Licia…

Albemarle Corporation (Ticker: ALB) is less than half the price it was back in November 2022.
The high then was $325 and it closed Wednesday at $142.50.
ALB made a double bottom at $113 in November and December this year with a divergence in the Relative Strength Index meaning as ALB traded back down the RSI made a higher low:
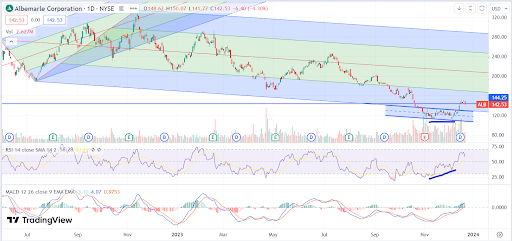
It gapped higher last week clearing my resistance at $144.25.
Looking closer at the chart, ALB looks like it is flagging here ready to take a leg higher:
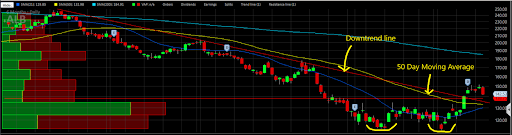
Resistance comes in at $153.80 and then up at $178.30.
Below here there is support coming in at $139, $136.15 and the 50 day moving average at $133.
As long as ALB holds $139.15, I think it is a buy.

ALB volatility in two time frames
Two trade adjustment to open positions for those following along in the Ticker Show:
BTO 2 OXY Feb16 55/60 strangles for $3.10. I closed the calls at 3.10 Wednesday
I put the trade on 5x so just bought the ARKK Jan19 52 calls for 2.64 vs. 5 ARKK Jan19 44 puts. Sold the ARKK Jan19 52 calls at $3.10 so own the 44 puts for a .14 credit.
When setting up volatility trades, I like looking at different time frames. On the chart below, I am using sigma vols for Jan, Feb and Mar. Remember Sigma Vols are just the average IVs for the expiration term. Note how the Jan vol jumped on Wednesday. That sets up for a good natural calendar trade, buying the Feb and selling the Jan. If I want, I hedge the call calendar deltas with a put.
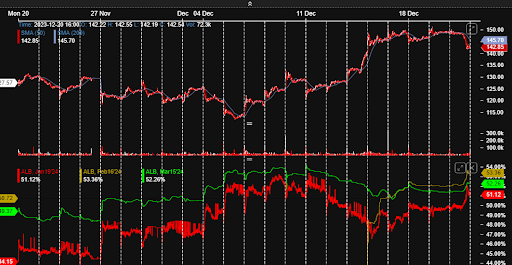
ALB 30 day chart with Jan, Feb and Mar sigma vols in Red, Yellow and Green.
Below is a one year chart of realized vol in blue for the past 30 days. Unlike stocks in general ALB is exhibiting some pretty high realized vol. In short, it is moving a lot. That helps to place my call calendar and puts just at the end of the expected move. The expected move is just the call and put value, the straddle, at the money for the Jan cycle.
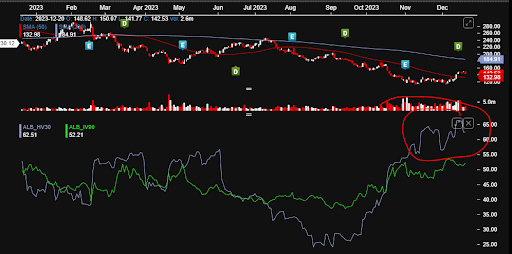
ALB 30 day chart with Jan, Feb and Mar sigma vols in Red, Yellow and Green.
What this trade will give me is a high expected value position with minimal time decay and then I let the stock go where it is going to go. If the conditions persist into Monday, expect to see a similar setup for our Ticker Show.
The Option Pit Team…
P.S. To see the live show every Monday at 10:30 just sign up for any paid service here at Option Pit... or call 888) 872 3301.
Questions about anything? Leave a comment below!

Mark Sebastian
Founder & CEO, Option Pit

See what's hot at option pit
CAPITOL GAINS: SMR Aug16 7 call closed for a 150% gain
DELTA STRIKE: VLY Mar15 8 puts closed for a 88% gain
PFE May17 26 calls closed for a 66% win
OP MENTORING: SPY Mar22/19 510 put calendars and 520 calls for 6.4% gain
OPTION SHOPPER: ERX Mar28 65 calls closed for a 90% gain