BY HANNAH SELNER
November 5, 2024
As traders, we always look for new trends (which usually are OLD trends) to trade. In fact, when one of our traders sees something unfolding, the first question I ask is: “has this happened before?”
This week, I found perhaps the best, closest historical example of a trend I have ever seen. Seriously, the charts looked copied and pasted.
It was on the VIX curve.
Now – orientation time – if you’ve never seen the VIX curve before, get comfortable. The VIX curve is a tool we use in almost every subscription here at Option Pit to help us understand current pricing of options and FUTURE pricing of options. It makes us (and you) smarter (read: BETTER) option traders.
It’s like getting an inspection of a house you want to buy. If there’s mold, you’re gonna know. And if it’s pristine, you’re gonna know. It helps us make informed decisions.
Now, there are 3 states the VIX curve can be in:
- Contango
- Backwardation
- Flat
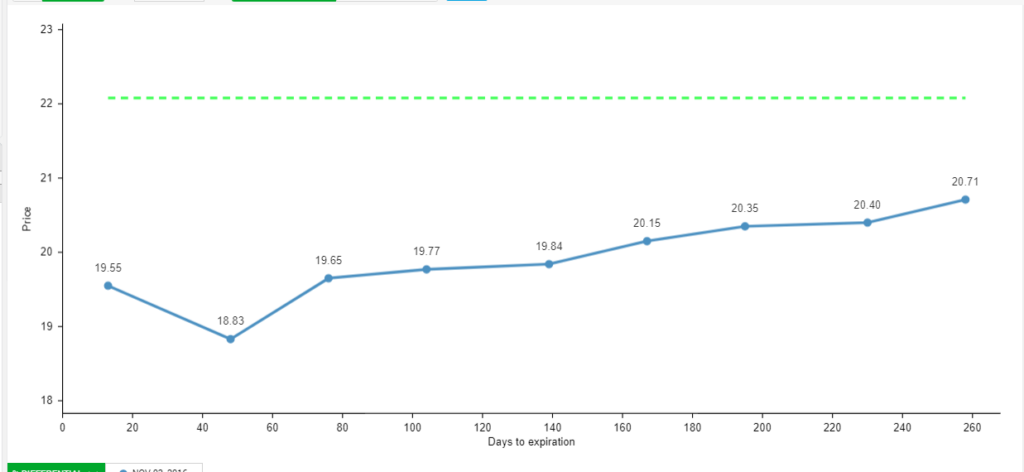
Here’s a picture of the VIX curve 4 days before the Presidential election…
In 2016.
(This is backwardation)
(One of the cool perks of CBOE LiveVol, a charting software all our traders use, is that you can back-date scenarios on the VIX curve and see what the curve looked like on any specific date in the past.)
Now, this VIX Curve was in November of 2016, 4 days before the election.
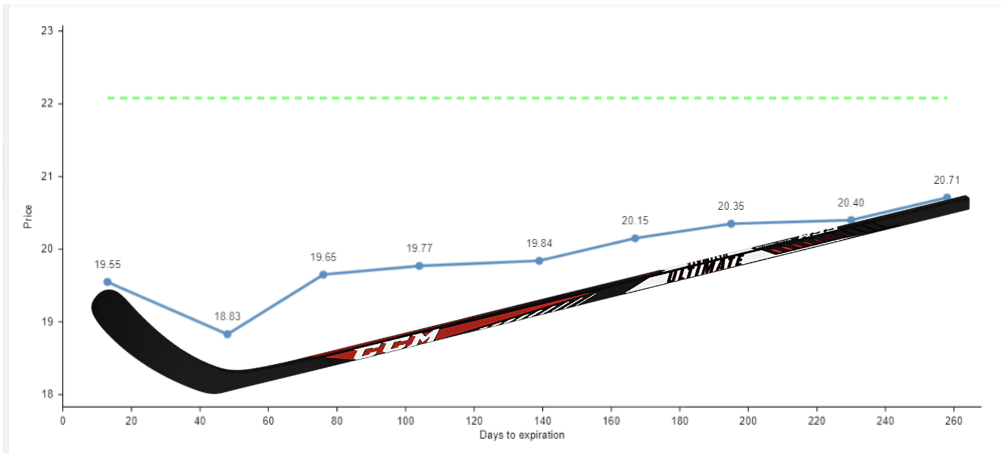
I call it: “the hockey stick.”
See it?
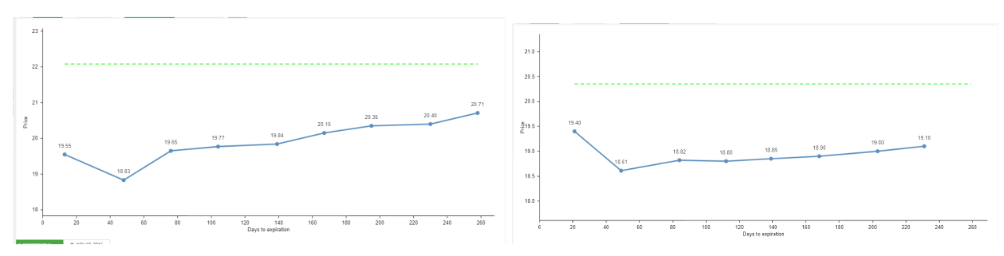
The green line was the “current” VIX price 4 days before the election = right around 22.
The blue dots below – the hockey stick – represent the projected VIX prices moving forward (VIX Futures) … 20, 40, 60 days to expiry and so on (you can find this on the x-axis for you math nerds, the bottom of the chart for you regular people).
In 2016, the VIX Futures (blue) were BELOW the current VIX price (green).
This is backwardation, and tells us the market anticipates VIX will move LOWER post-election, which makes sense – the election uncertainty holds VIX up, and post-election… it should drop.
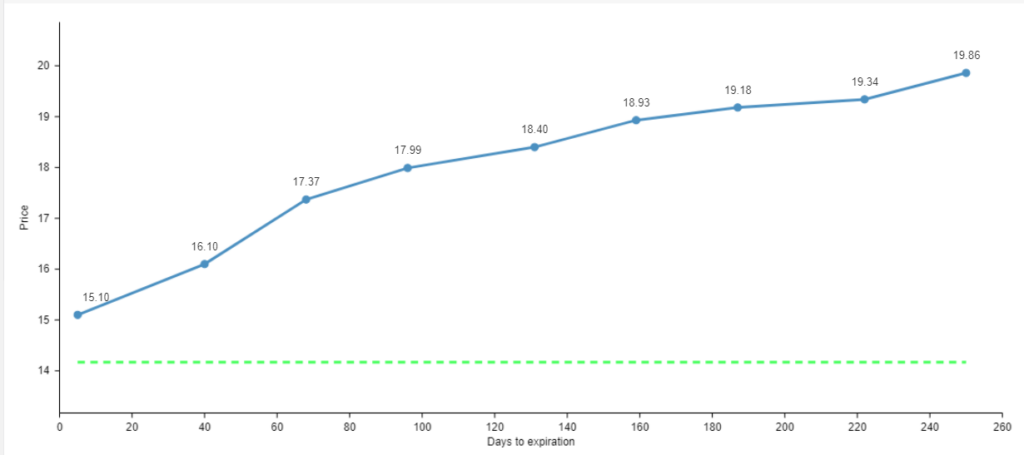
Here’s 2016 VIX curve POST-election:
(This is contango)
Sure enough, VIX drops to almost 14 (green) and VIX Futures (blue) are back to being ABOVE the current VIX price.
It’s flipped to contango. So that’s a 8 point drop in VIX from 22 to 14 in just a few days between PRE → POST election.
Fast forward to today.
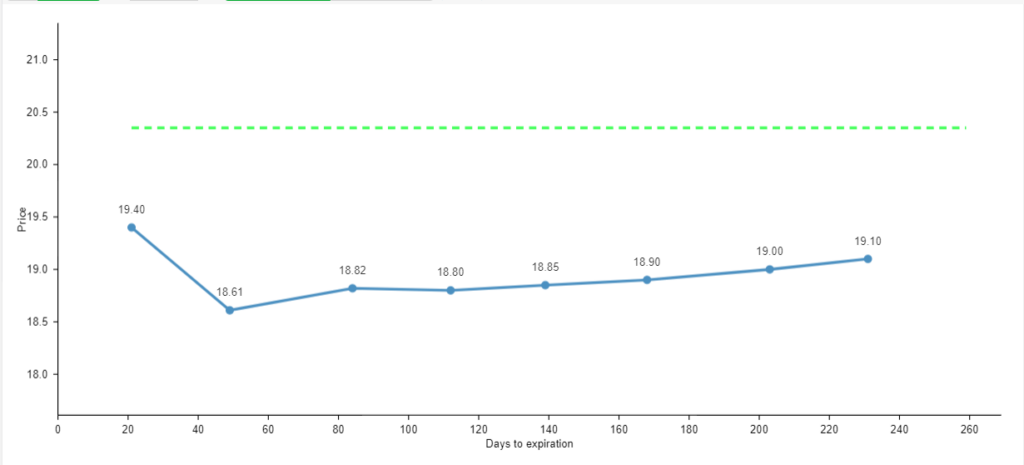
Here is the VIX Curve 4 days before the election:
Here’s 2016 and today side by side – so you can see just how freakishly similar they are:
I mean, HOLY COW! It’s like the Toronto Maple Leafs out here!
Here’s what this tells us. If we know where the Vol Curve was in the past and where it moved TO (***KEY***) after a catalyst like the Election, we can assume with a higher degree of certainty that the Vol Curve is MORE LIKELY to behave the same way today, especially when the “before” charts match so exactly.
So, this means…
Volatility (VIX) should go DOWN post-election.
You may think “duh Hannah,” or “we know that.”
But if you do know that, or you think that – you should express that high-conviction idea with a trade. This is why our Special Situation 2024 Election product was created – and last Wednesday we put on this trade, a VIX short (an option contract that bets the VIX will go down post-election, just as it did in 2020, 2016, 2012 and beyond – ).
We also believe that the VIX curve flipping from backwardation (now) to contango (post-election) will have other key ramifications.
We’ve pinpointed a single strategy we think will benefit the MOST from the lower volatility, which we project should last from 3-6 months.
And it’s all based on a Post-Election Trend no one else is watching.
I shot a short video for you on it here – check it out.
Enjoy your week & talk soon,
Hannah

Hannah Selner
Director of Product Development, Option Pit
See what's hot at option pit
CAPITOL GAINS: SMR Aug16 7 call closed for a 150% gain
DELTA STRIKE: VLY Mar15 8 puts closed for a 88% gain
PFE May17 26 calls closed for a 66% win
OP MENTORING: SPY Mar22/19 510 put calendars and 520 calls for 6.4% gain
OPTION SHOPPER: ERX Mar28 65 calls closed for a 90% gain