

Yo Pit Crazies,
The last ten days have been a perfect example of what happens in a bull market. Stocks can go down, even the ones that were straight up for several months. It’s natural as traders cool on names and start to look at others that aren’t going straight up.
Below is a ten day chart of the Invesco QQQ Trust (Ticker: QQQ). It was up over 30% this year as traders jumped onto the AI bandwagon. Things are cooling off 3% from the top.
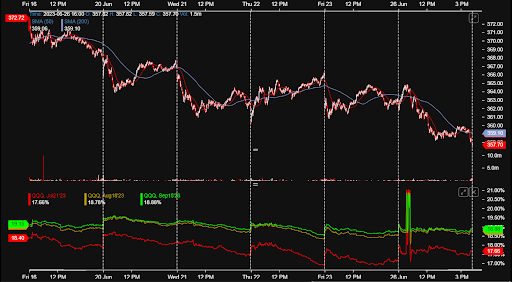
10 Day chart of QQQ with 1 min candles, Sigma IVs in Jul, Aug and Sep below
It’s important to set up for drops like this. That’s part of how I set up the Easy Button so we can close some puts today if the weakness persists.
There’s a more curious flavor to this drop in QQQ, can you see what it is?
Sigmas Are Flat with the Drop in QQQ
Sigma is the average volatility per term, usually a few strikes above and below the money and the atm strike in an average. It’s loosely like the VIX calculation but with far fewer strikes. Sigma is only the term, and not a floating 30 day moving average like VIX. The Jul Sigma will slowly move to expiration, so time to expiration is important.
That is why I find the chart below curious. Aside from the data anomaly Monday, Sigmas are flat to declining since the peak on ten days ago. That’s not the stuff of a bear market, but just a temporary selloff.
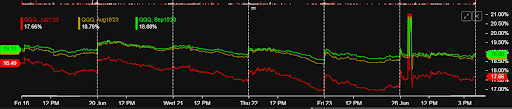
It’s a relief selloff. Stocks went so far so fast, they had nowhere to go but down, and the implied ride up with it. The QQQ selloff is coinciding with the drop in vol. Big earnings are still many weeks away in big tech. I expect the bid for QQQ stocks to return going into earnings, so this selloff should be short lived.
Back to the Easy Button, I should be closing my puts in MSFT and AMD today, and getting ready for the ride back up in the calls in the coming weeks.
To Your Trading Success,
AG