

Dear Trader,
Most really tough bear markets have two bottoms. Two bottoms? How’s that possible, you ask? Let me explain how it works, and how you’ll know when it’s time to step in and buy.
In 2008-09 the market obviously took heat all the way through March of 2009. But if you look at the chart, you can clearly see the two bottoms of that stretch:
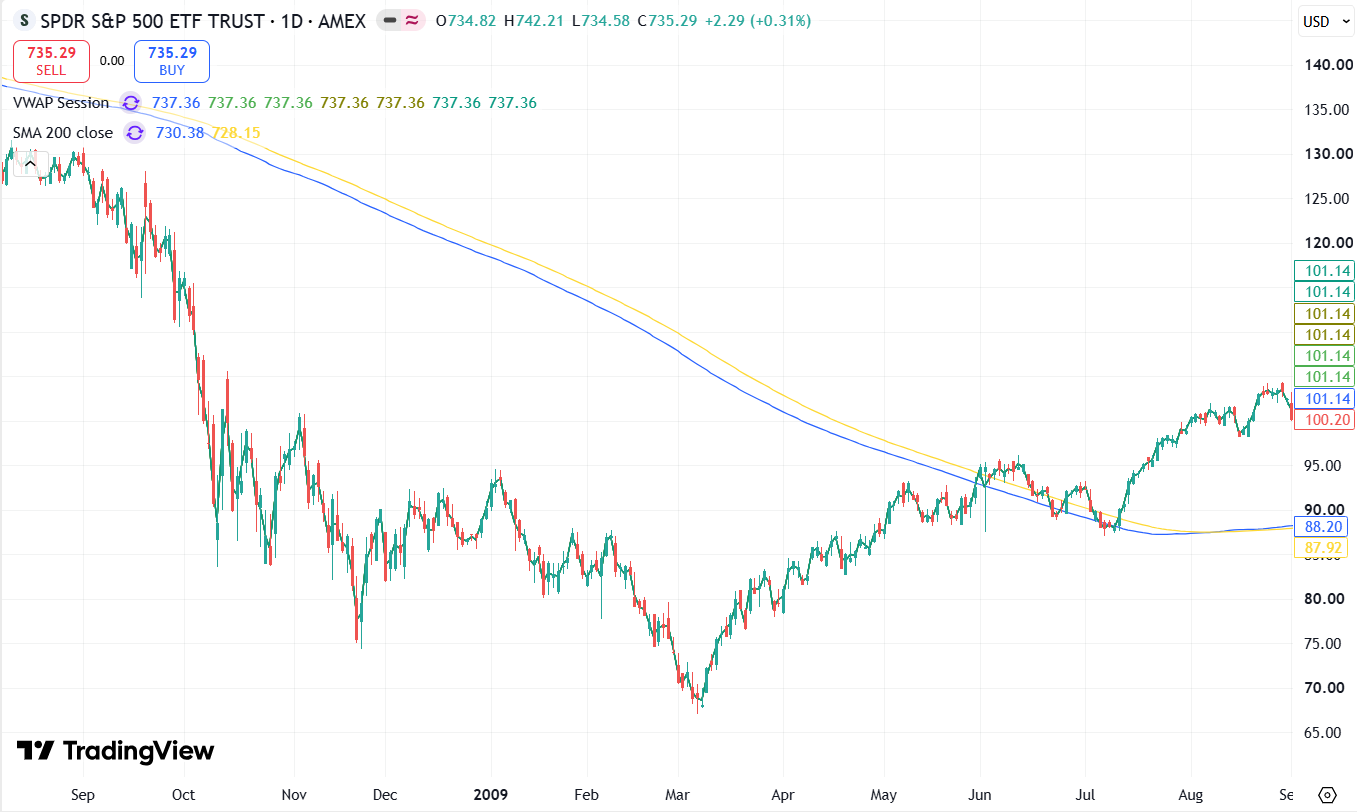
The first bottom came in November of 2008, as we headed into Thanksgiving. You can see that sharp drop and the nice rally that follows it.
The market channels for a bit, then we get the second selloff and bottom out.
Now I’m going to look at the VIX (the market’s fear gauge, priced off S&P 500 options) over that same stretch.
I think you’ll clearly see the difference between the two bottoms, and then I’ll explain why.
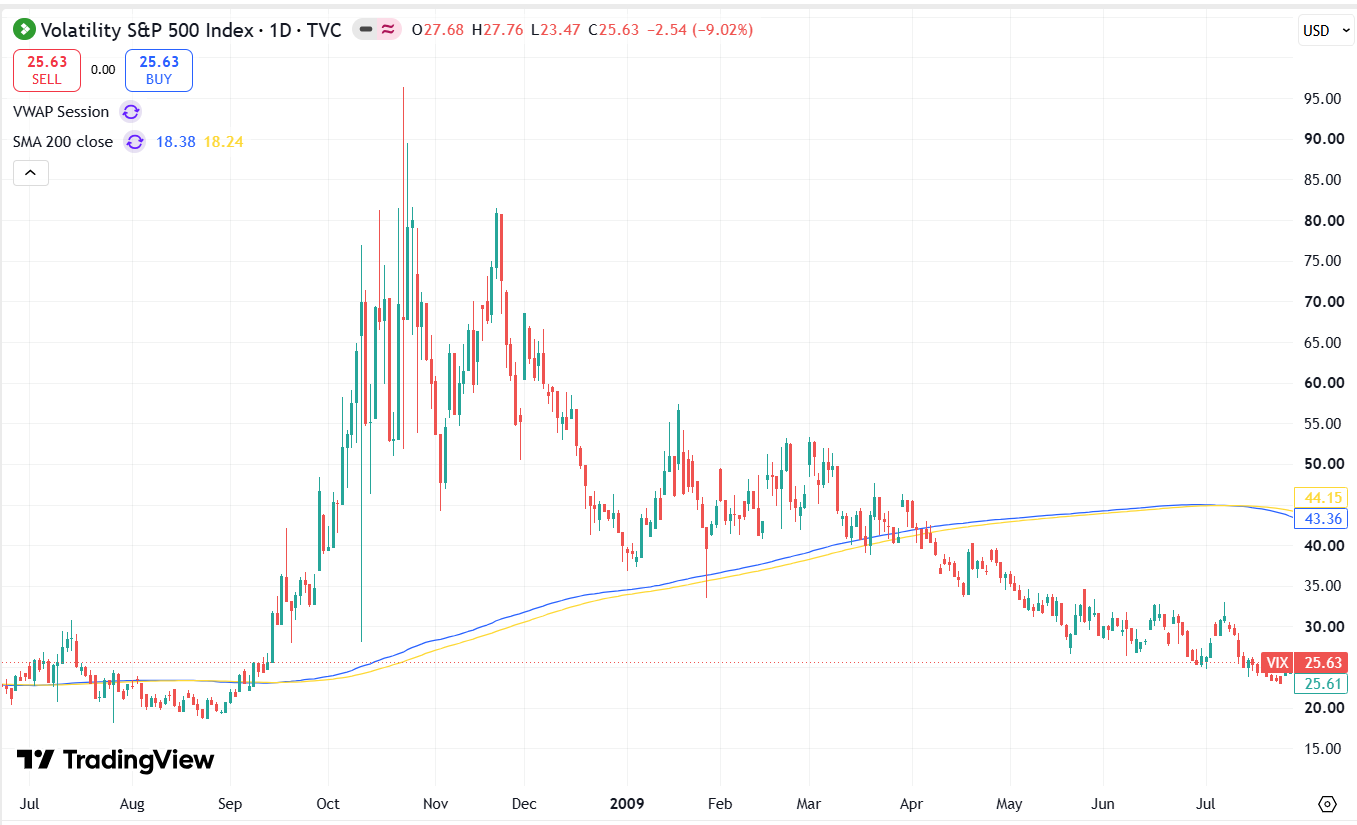
Notice that at the November bottom the VIX is touching 80. At the March bottom it’s around 50. Still high, but nowhere NEAR the 80s the market was living through in October and November.
So what’s the difference?
- At the November bottom, the market sold off in fear.
- At the March bottom, sellers were saying FEH, not panic selling.
But more importantly, something big happened between those two bottoms. It set a floor under the market even in March, and it absolutely set a top in the VIX.
From October through December, Warren Buffett got heavily involved and got super long.
That on its own gave the market confidence. But HOW he did it is what kept the VIX so muted.
He UNLOADED puts in the SPY, the QQQ, a bunch of his favorite equity names, and several banks.
Normally when someone sells puts (gets paid up front to promise they’ll buy stock at a lower price), they’re saying the market isn’t dropping much further. With the VIX at 80, Buffett said more than that. He said the floor is in, and he collected so much premium doing it that even at the March low, traders owned so much downside from his sales that the VIX couldn’t get off the mat.
In fact, he sold puts at such a high VIX that he might’ve been up on them even at the bottom in March.
Buffett taught the market a major lesson: when the VIX is high and the market is tanking, selling puts is an EXCELLENT way to call a bottom. So when you see heavy put selling with the VIX high and the market down, traders think the “all clear” is close.
This is where The Mine comes into play. The Mine is a custom-built scanner for large block order flow. It shows me the kinds of buys and sells I’m looking for, the kind I statistically win on.
So on Thursday, as the Nasdaq 100 had its worst day since 2020, I went looking for heavy put selling in The Mine:
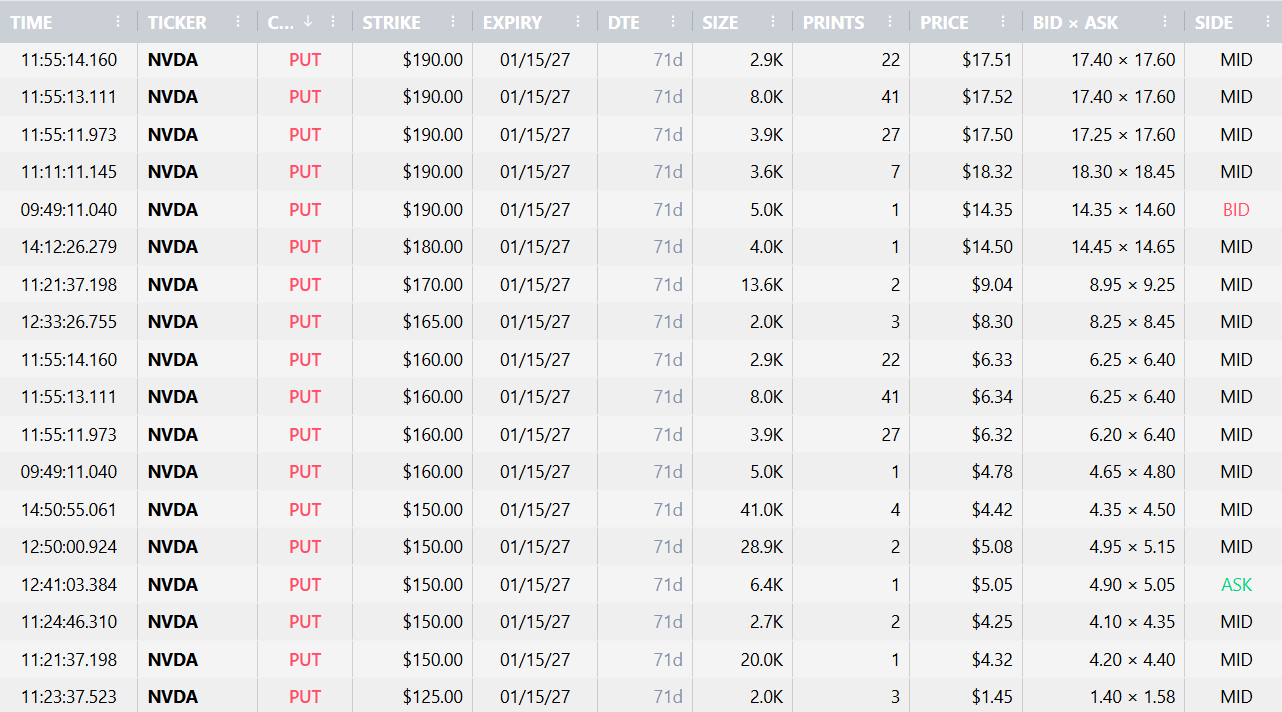
This is the put activity in Nvidia (NVDA). The put sales that DID happen were traders taking profits, and most of the other activity was traders BUYING puts. That tells me the floor isn’t in yet.
Maybe it hits this week somewhere around here, maybe we dump further. What I do know is that with this tool, I’ll see the big block traders come in to sell puts in names like NVDA as they call the bottom.
When I see that, I’ll go long, and not a day sooner. I’m going to show you how to use this fabulous tool in a one-week Master Class starting Monday.
Join me, and if the bottom comes this week, we’ll all see it together.
Your only option,
Mark Sebastian