

Dear Trader,
In August 2015 I was running a two way trading strategy using VIX and SPX against each other. Andrew was of course working with me on this (he and I partner on just about everything trading), and this approach eventually because of Andrew's two way trades he uses in weekly profit cycles.
As part of the trade I had on I was long SPX puts expiring in September. Up until the middle of August, the market was in a general malaise and was just slowly grinding higher. At the time, the trade war with China was several years away. China was considered a major driver of economic growth even in the US as its economy was exploding.
Then in mid-August some rumors started to circulate that China’s economy was maybe not as good as we all heard and the S&P 500 started to react. Starting on August 20th the S&P 500 started selling off in a way it had not since the debt downgrade in 2012.
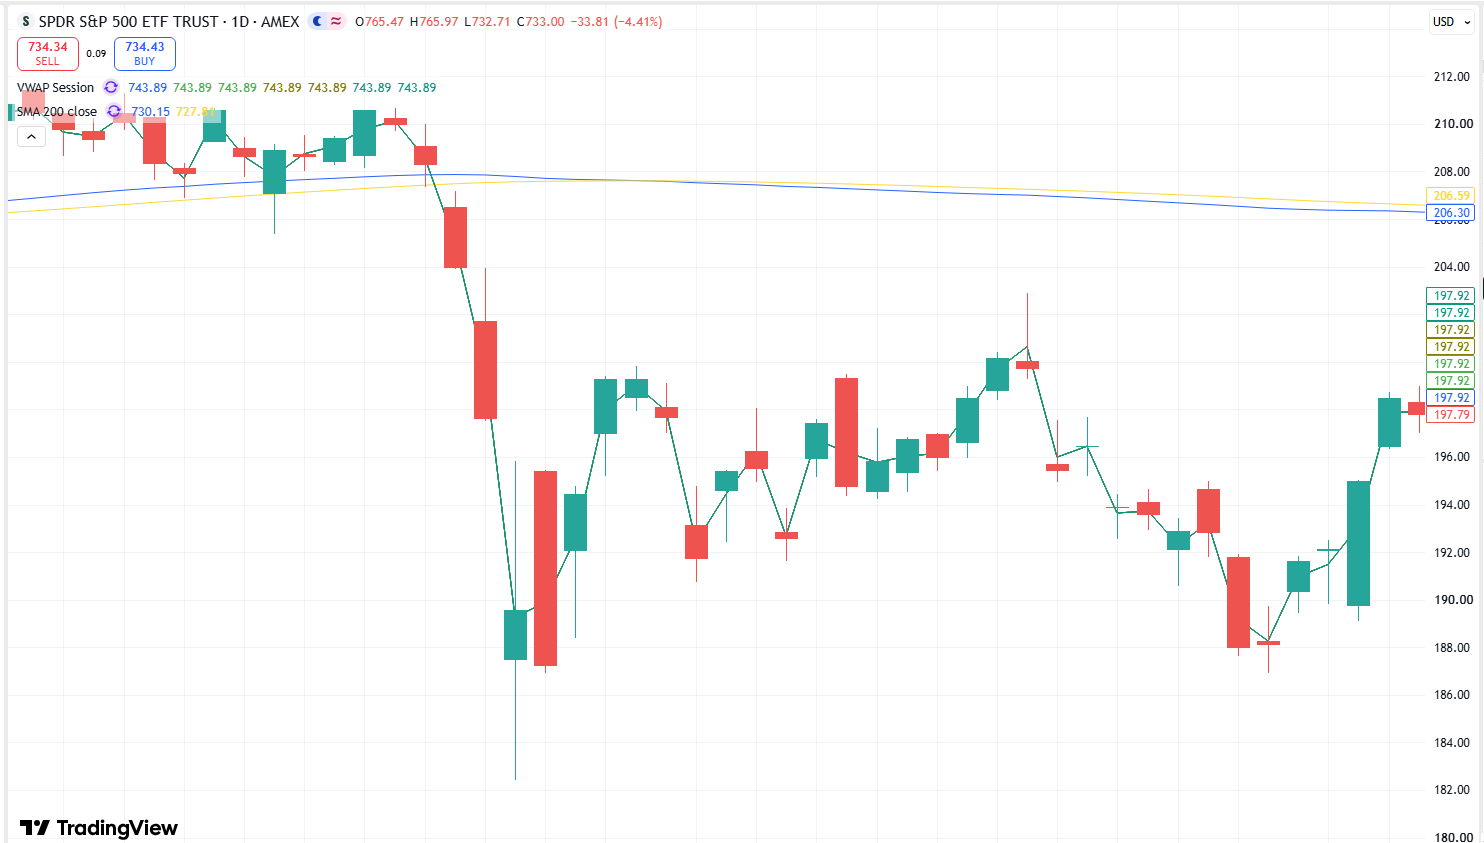
What I want to focus on here is the 200-day moving average. On the 19th, it kissed the 200 DMA. On the 20th, the index broke below the 200 DMA and powered its way lower. That was Thursday. Friday was even worse, and then Monday the market absolutely collapsed in the overnight hours and at its lows was down 100 points… might not sound like a lot, but that was more than 5% of the value of the S&P 500 at the time. You can see how wild the movement was on that Monday.
What does this have to do with the major selling that happened on Thursday? This was the last time the S&P 500 opened on a Thursday at or below the 200 DMA and then POWERED its way lower:
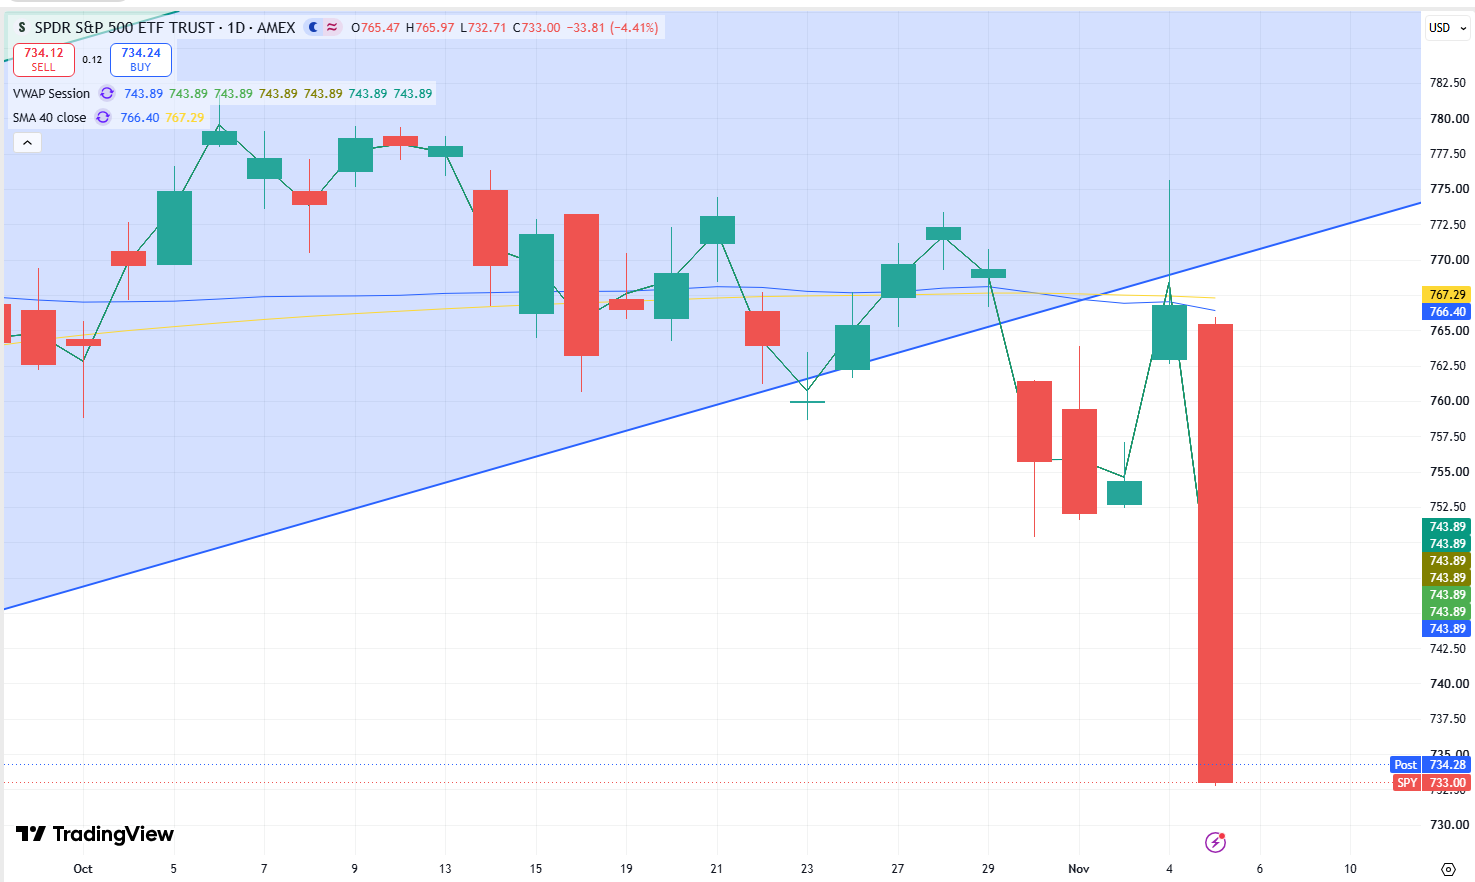
Now, does one data set from over 11 years ago provide any definitive information on how Friday and Monday play out? No. But it does give us a potential blueprint if Friday looks as bad as or worse than Thursday. Thursday was the ugliest day I can recall since early in the Covid dump of Feb-Mar 2020. And based on what we saw in 2015, we could see some follow-through. We certainly got that in 2020.
What’s interesting is that there’s something every major selloff has in common… a HOT market that’s running out of gas, rumblings of a macro problem forming, and then something to drive that fear to the forefront.
Reading all of this might have you assuming I’m pressing short positions. No. The ones I had, I closed on Thursday. Because all of those events happened before 0DTE options. Traders can now hedge intraday or for the next day rather than only having monthly options (most of trading history) or weekly options (the last 10 or so years). They can hedge to the exact date they want to protect.
This doesn’t mean we can’t tank. We can. But it also means that big selloffs can bring almost as big snap rallies in the door following them.
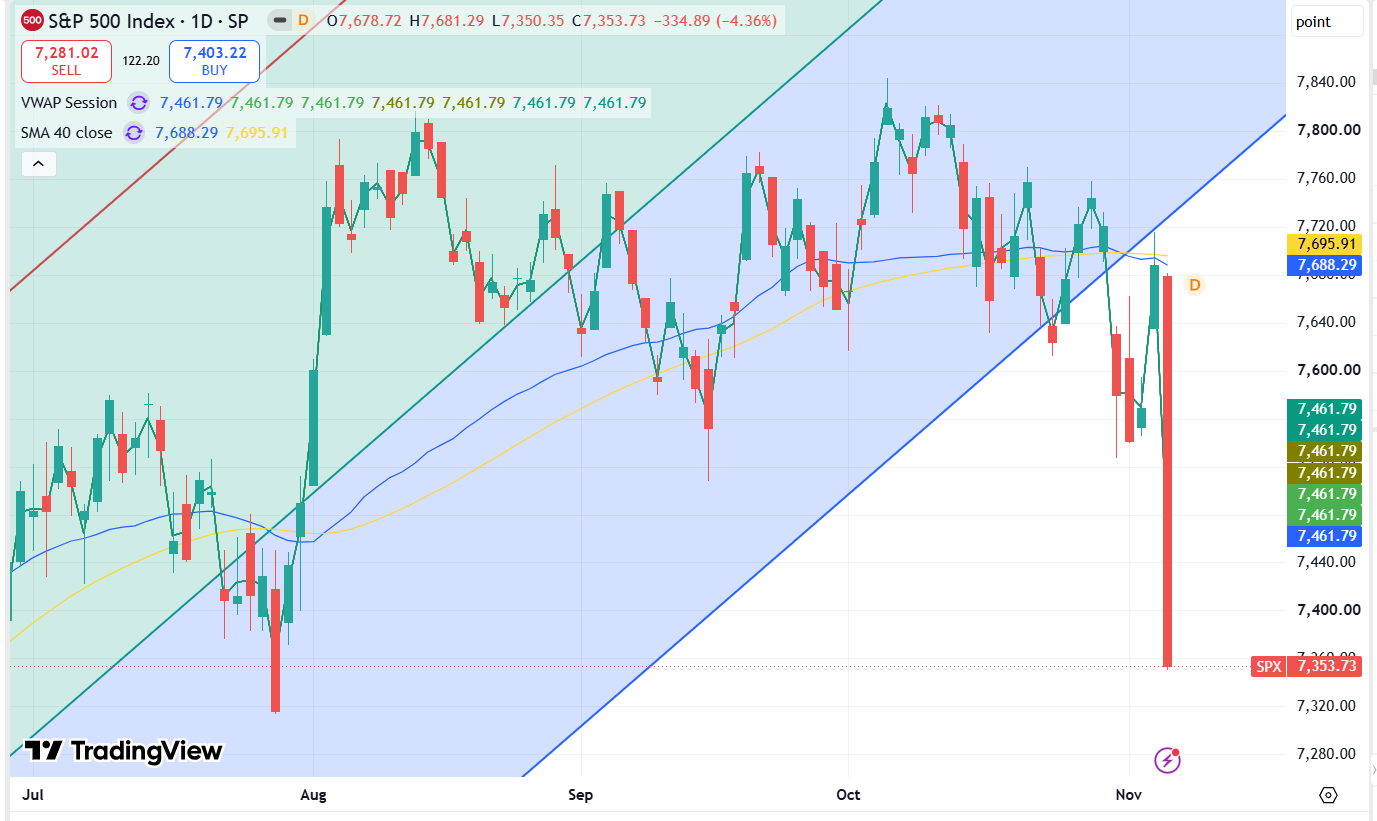
Remember the last time we were this low? It was at the end of July. Take a look at what followed. Doesn’t make you want to press a short too hard, does it?
So what’s the approach to this? On Thursday I was executing two-way trades, trades that win if the market goes up or down, similar to what I was discussing at the top of this article.
That August of 2015 made my year… because I was able to take advantage of the selling AND the recovery that followed.
That’s part of the plan with Cycle 11, except there’s a twist…
You rarely see a setup like what we’re seeing straight out of an election year. And I say rarely only because I definitely haven't seen it.
And what that does is ramps up the volatility we’ll see over the next 60 days. Cycle 11 is designed to let you turn that volatility into plays that make money over and over again.
My first play goes out Monday. And if the last three days are any indication, there’s a lot more moves to make as we get deeper into December.
And… one more twist.
I’m adding a free month of Andrew’s two-way trades to anyone who gets into Cycle 11.
Tap this link to check it out.
Your only option,
Mark Sebastion