

Yo Pit Crazies,
AG's alter-ego Vol Man here with my weekly analysis.
As usual, I start with my last forecast…
Last Week’s Big Call
Will Congress figure it out when they get the bill for borrowing $2 trillion at 5%? Total lack of Congressional leadership, since it's Congress who budgets (used to) and spends.
I'm looking for AI not to kill us this week, and to see if the sentiment changes and the USA runs some positive bots. I do think it'll be an inside week (SPY stays within last week's high and low) unless there's solid progress in the Middle East. VIX to 14.25 and SPY 770.’
I did not write up Vol Man since I was out last weekend. SPY did trade 770 and higher and VIX got to 14.35 so not too bad for the week of the 21st. The AI is going to kill us sentiment was the near term market bottom the prior week.
Stocks are mostly trading on inflation, interest rates and oil prices right now. 10 year yield jumped way over 5% and Oil prices briefly surged this week. As Tim Colby our Macro Guru said, the rate of change was quite steep. So the chart I am going to move to is the Barclays 7-10 year US Gov Bond ETF (IEF). The moves into the end of the week were quite big for bonds and that volatility bleeds into stocks.

IEF 6-Month Chart
Bond volatility is leading to market volatility for stocks. The last two weeks have been out of category moves in interest rates. Read on!
The Weekly Wrap Up
Another week with 17-year-high interest rates, but stocks still ended on a high note. I wrote that two weeks ago and it is the same for this week except interest rates are even higher. There are now two constituencies for borrowed money, the Federal Government and AI buildout.
Micron Tech (MU) posted another huge number and Anthropic is going IPO just in time for Thanksgiving which many VCs will give thanks for. The AI growth story is still on track which is the biggest bull story there is.
The biggest story that is not getting news is Iran. For the first time this year, SOH oil volume is back to 98% of pre-conflict levels and Iran exported 0 barrels though the Strait of Hormuz (SOH). That brought oil prices to early Sep levels. Add to that a goldilocks number for NFP and that spurred a rally to weekly highs in the S&P 500 Trust ETF (SPY).
Mini Rant
The Strait of Hormuz (SOH) is back to 98% of oil traffic, but you won't hear that. Iran is sending 0 barrels through the SOH. Congress somehow cannot pass any meaningful legislation on voter ID, spending or insider trading. Meanwhile, Login.gov might quickly help the fraud problem once it goes wide.
I'm sure they'll form a committee. This is another good reason for the USA to take the lead in nuclear energy.
It's time for the Fed to publicly shame Congress for spending. The grift and theft going on is unreal. The Fed just giving tax dollars away to programs with no oversight is insane.
Yet no one in Congress does a thing about it. At least vacation keeps them from making things worse.
(Every Friday, The Options Insider Radio Network’s Vol Views offers bonus volatility insights with either Mark or myself, no charge!)
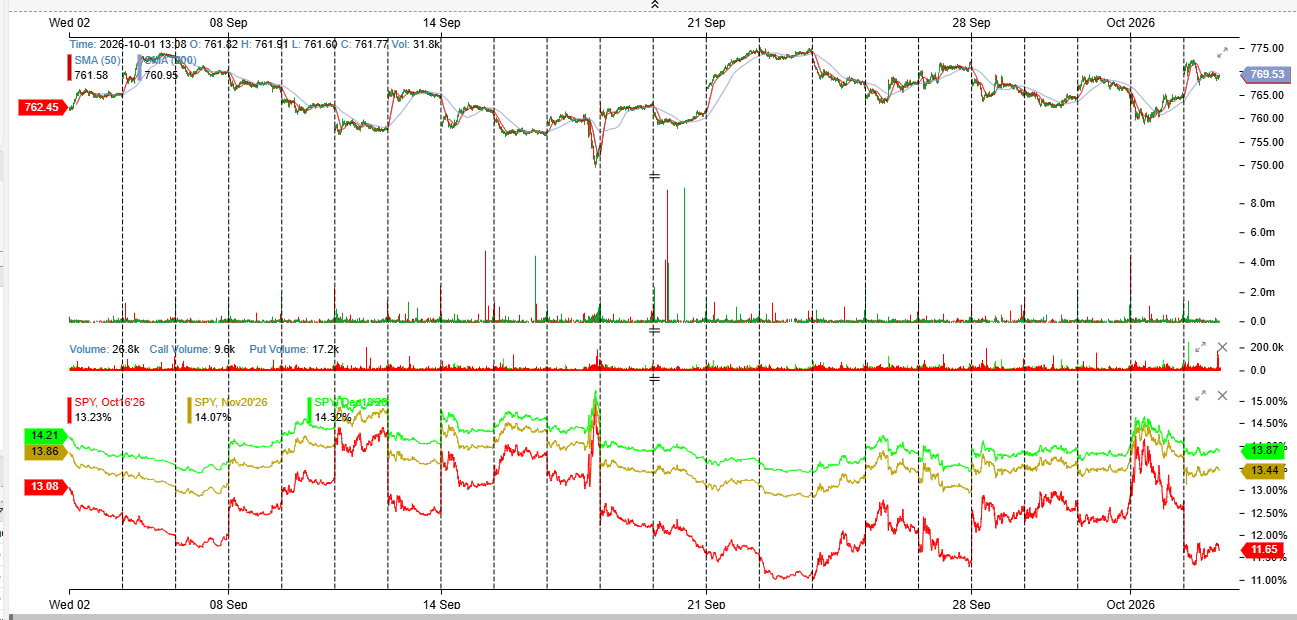
SPY daily price action over the last 30 days with one-day candles. SPY Sigma (volatility per term) for Oct, Nov and Dec
SPY finished the week higher to close at $770. Most of the news was good except for the interest rate train coming down the tracks. I do notice that Nov sigmas are still elevated with SPY near all time highs. Traders are baking in a bit more expected move.
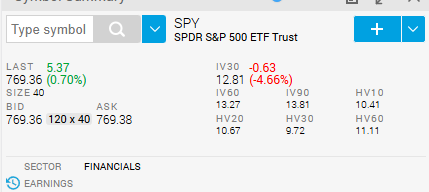
SPY Realized Volatility snap on Oct 02, 2026
Here's what realized volatility means: it measures how much a stock actually moved over a specific time period. Think of it like checking your car's odometer after a road trip. The odometer tells you how far you actually traveled, not how far you planned to go.
High realized volatility means big price swings. When SPY has high realized volatility, the market is unstable and prone to sharp drops. When HV10 (realized volatility over the last 10 trading days) is under 10, stocks aren't going anywhere.
Realized volatility is now under 10% for the last 30 days. This week was another light move week with barely a 10 dollar SPY range for the week. Low realized volatility is not what bear markets like.
VIX Volatility Curves
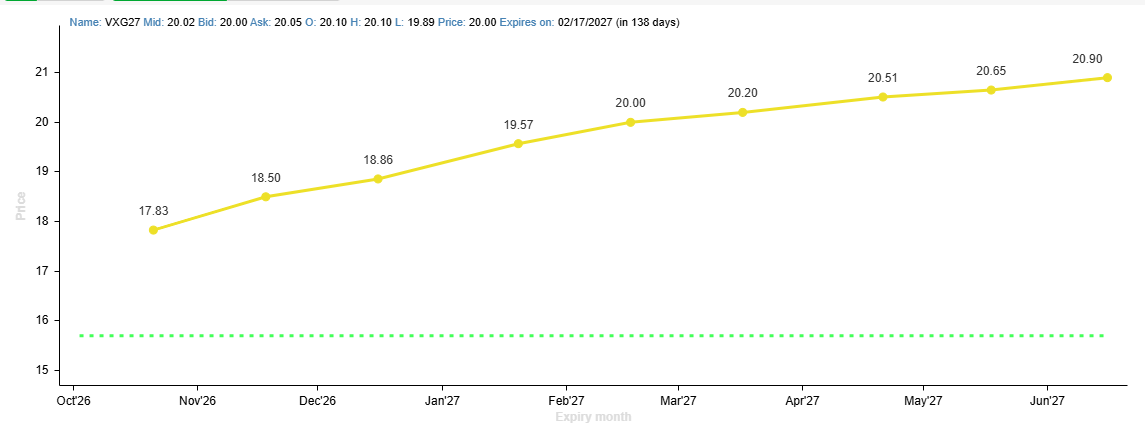
Closing VIX cash and curve Oct 2
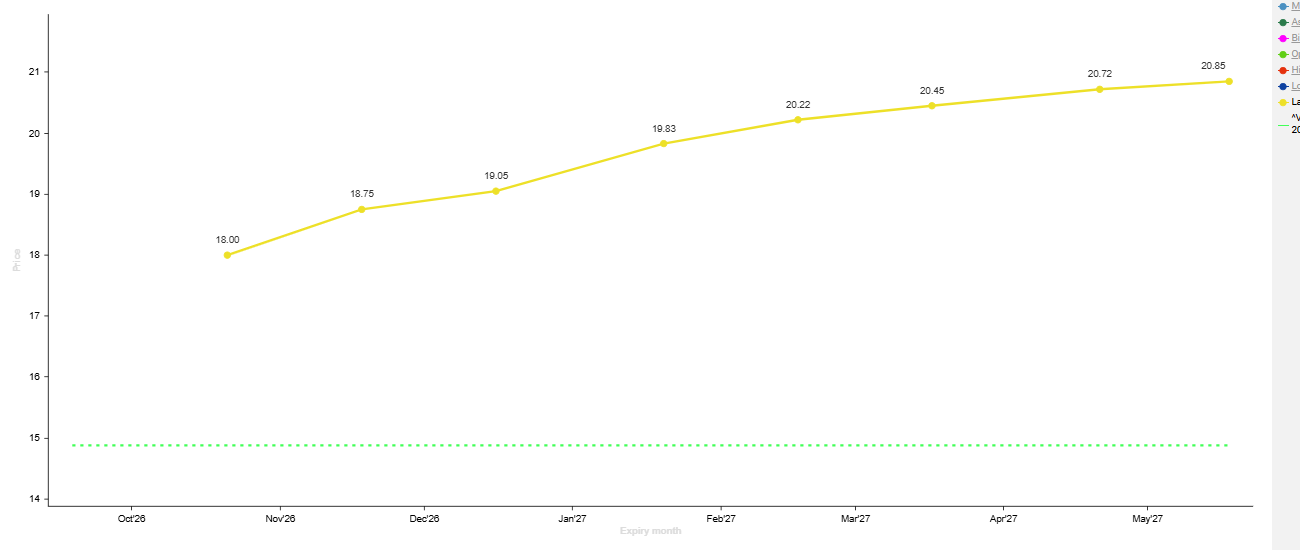
Closing Curve Sep 18
The VIX curve is in contango. The Oct contract is basically unchanged for the last two weeks. VIX is higher of course but SPY is higher too. There is still the smell of a move coming soon.
(Check out Volatility 101 basics on our Option Pit YouTube channel, now streaming.)
OP VIX Zone Watch
VIX ZONE 1 9-13
VIX ZONE 2 13.01-17.99 We lived here
VIX ZONE 3 18-23.99
VIX ZONE 4 24+
VIX kept in Zone 2 with a brief rally on Thursday as folks freaked out about interest rates. Zone 1 in VIX is still on the milk carton of missing indicators.

VIX 30-day chart with one-minute candles
VIX is up over the last two weeks. It is now sampling the election volatility cycle and since bond yields started their spike two weeks ago, VIX has responded by making higher lows. Stocks and VIX are rallying, just like into 2020 election.
The Big Call
Interest rates can go up but the speed is unsettling traders. Higher VIX and high stocks are usually a volatile brew but that volatility could also be a squeeze up. If there is better Iran news next week, SPY could rally 2% easy.
I think VIX is mostly hanging in the low 15s all week since it is a light news week. Earnings do not start until the following week but I can see a solid slow rally to 780 SPY into what could be the biggest earnings cycle of the year.
Tap this link to see how you can trade it next week.
To Your Trading Success,
Andrew