

Hi Traders,
Last Wednesday, Microsoft was my stock to love with a target at $513.73.
It ran through that number on Friday and then started rolling over, so this week I'm going the other way on it.
My favorite stock to trade higher this week is Walmart (WMT):
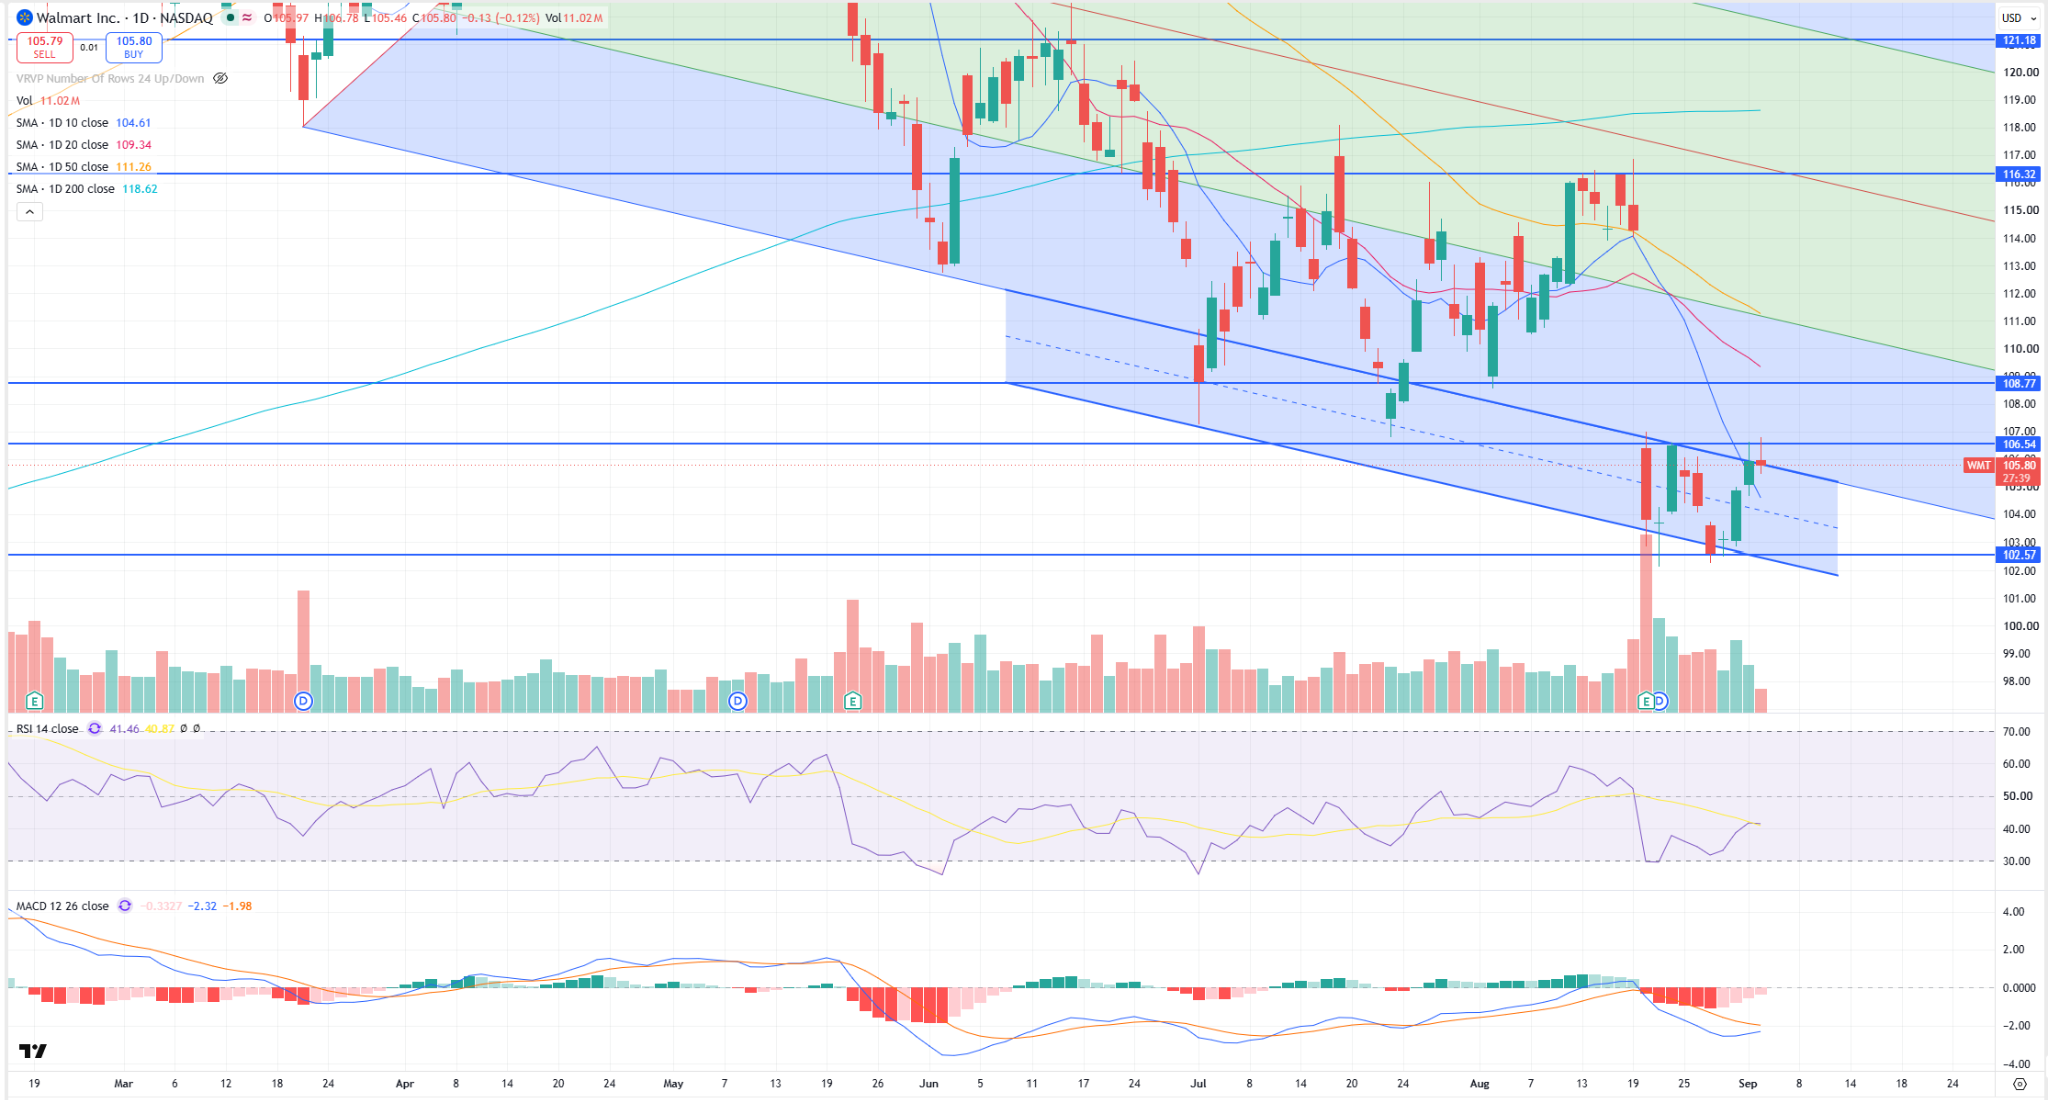
Walmart fell nine percent on August 20 after earnings, from $114.30 to $103.84, its worst earnings-day reaction in ten quarters. Revenue came in at $187.9 billion, e-commerce grew 23 percent, and management raised its full-year sales outlook. The profit guide came in under estimates and US comps slowed to 2.6 percent, and that's what sellers latched onto.
That drop left a huge gap on the chart.
The stock has spent two weeks forming a base (a stretch of sideways trading where the sellers run out of stock to dump) right around $105, and Goldman reaffirmed its buy rating on Monday. It's ready to pop over the resistance at $106.54 and rally to close that gap.
Now wait for it to clear $106.54 along with RSI (the Relative Strength Index, a momentum gauge that runs from zero to 100) moving back over 50. Above 50 means the buyers are back in charge.
The first stop will be the 20-day moving average (the average closing price of the last 20 sessions) at $109.34. Then the 50-day moving average at $111.26 and the top of the gap at $112.73.
Be sure to close and roll as it rallies, meaning take your profits on the calls you own and use some of that money to buy calls at a higher strike. You stay in the trade without handing back what you've already made.
On the flip side, I'm looking for a drop in Microsoft (MSFT) into my next pitchfork channel:
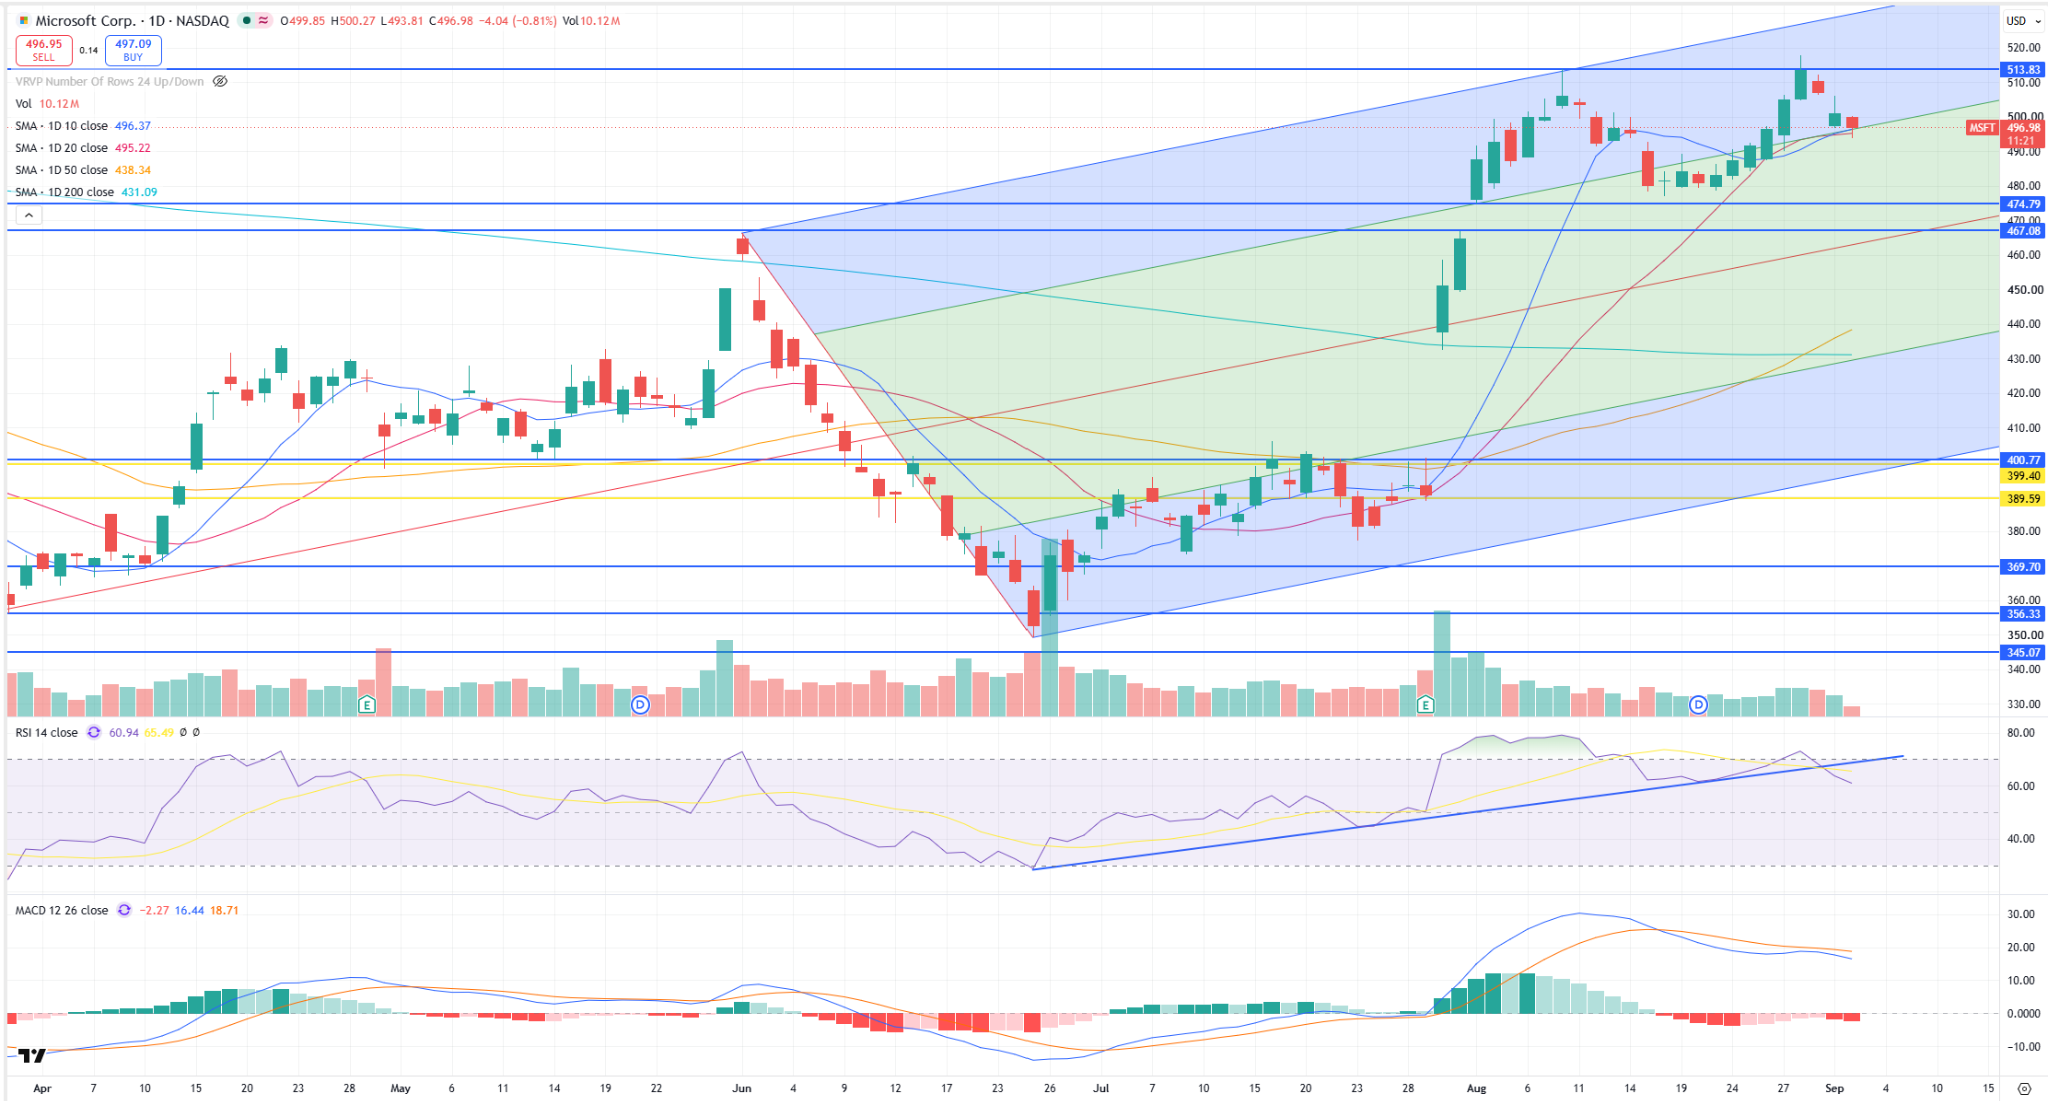
Microsoft gained 14 percent in a month after that big earnings print in late July. Through last Thursday the stock was only up about five percent on the year, so nearly all of its 2026 gains came in those four weeks.
A run like that on an index heavyweight usually needs a rest, and I'm seeing the start of one on the chart. Microsoft topped out at $517.78 last week and closed Tuesday at $501.02. Bank of America raised its target to $600 this week and the stock went down anyway.
For this one, wait for a close below the 20-day moving average at $495.20 before hopping into those puts. It traded down to $495.30 Wednesday morning, so that trigger could come fast.
The Relative Strength Index has come down from overbought (a reading over 70, where a stock has run further than the buying usually supports) and moved back below 70. That's a sell signal.
Support below comes in at $479.96 and then $474.79. Closing the gap created on August 3 would take it down to $467.08 and the median line (the middle line of the pitchfork, where the stock spends most of its time).
So what will the crew choose for the Ticker Highlight pick of the week? Tap this link and pick your subscription rate and get Monday's pick as soon as it hits.
Trade Accordingly,
Licia Leslie