

Yo Pit Crazies,
After the shellacking stocks took last week, traders went into the weekend hoping good news would set things straight.
That happened for a while on Monday. It did not last.
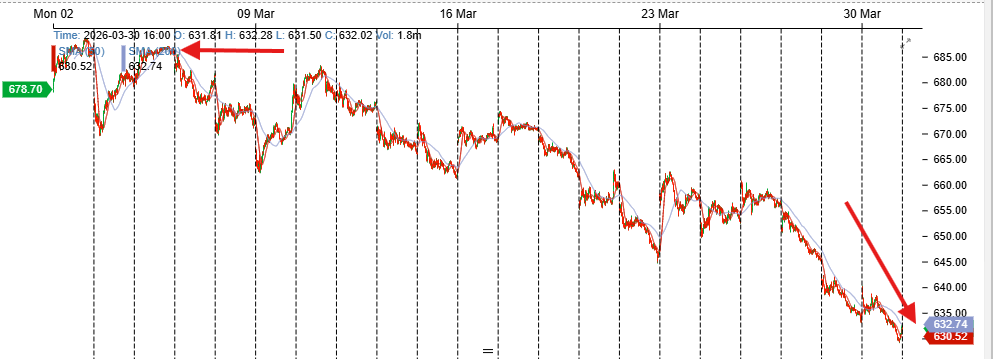
SPY 30 Day Chart
The chart tells a story of a slow meltdown. That is not what happens historically when the USA goes to war. Usually conflict marks the bottom and things improve from there.
Iraq is barely in the news these days. Asia has been at peace since WWII. Europe too. Most of the Middle East has been stable except around Israel and the constant attacks on it. Iran has sponsored those attacks, pretty much at will for 50 years, until very recently.
When I Connected the Dots
In most of the cases above, USA involvement came after events reached a breaking point.
The Iran/Israel tension has been on and off for years. The October 7th Hamas attack was a massive escalation. Since then, a series of skirmishes have built pressure slowly.
That is when it hit me: USA involvement this time is the starting point, not the finish line.
The Strait of Hormuz Card
Stock traders followed the historic playbook in Week One of the Iran conflict. Stocks held up because the thinking was this resolves fast. Look at the chart and that was the case.
Then reality set in.
It will not be fast.
My read now: the Trump Administration knew Iran would play the Strait of Hormuz (SOH) card eventually. That is where we are, and the world is dealing with it.
Short term, this gets messier. The end goal, I believe, is USA control over the SOH. Now that Iran played the card, it cannot go back in the deck.
The stock action since Week One looks more like the run-up to the Iraq conflicts, not the aftermath. 35 years of watching this stuff and it hit me: the starting point is different this time because the problem is different.
The Dow Jones Industrial Average was 2,800 in 1990. It is up 20x since then. That was a time to go shopping for stocks.
To get follow up intel and more, check out the Ceres Club at this link.
To Your Trading Success,
AG