BY ANDREW GIOVINAZZI
March 6, 2025
Yo Pit Crazies,
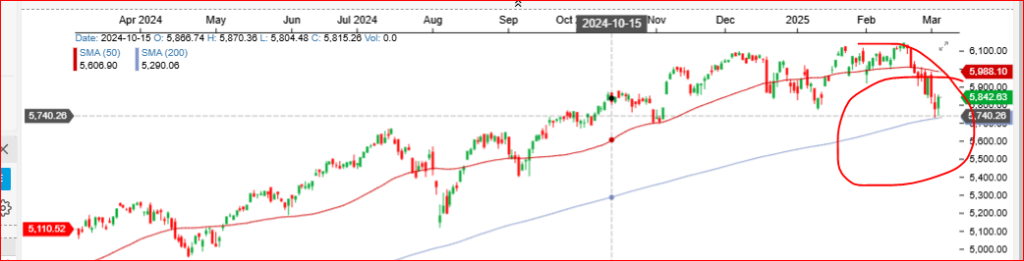
Traders are scratching their heads because they cannot get a handle on which way the market is going lately. SPX just traded down to 5740, the blessed 200 day moving average and bounced back like a rubber ball.
I have never figured out the significance of the 200 day MA but it seems to work. Charlie Munger of Berkshire Hathaway fame said buy quality stocks below the 200 day MA and you should outperform the market. He knew something about buying stocks in his 80 years of the market.
1 year SP 500 Chart with a 200 day moving average in blue
Or you could just get daily signals for S&P 500 ranges and decide to trade those.
What I do like about the 200 day moving average is that folks look at it and it is an inflection point.
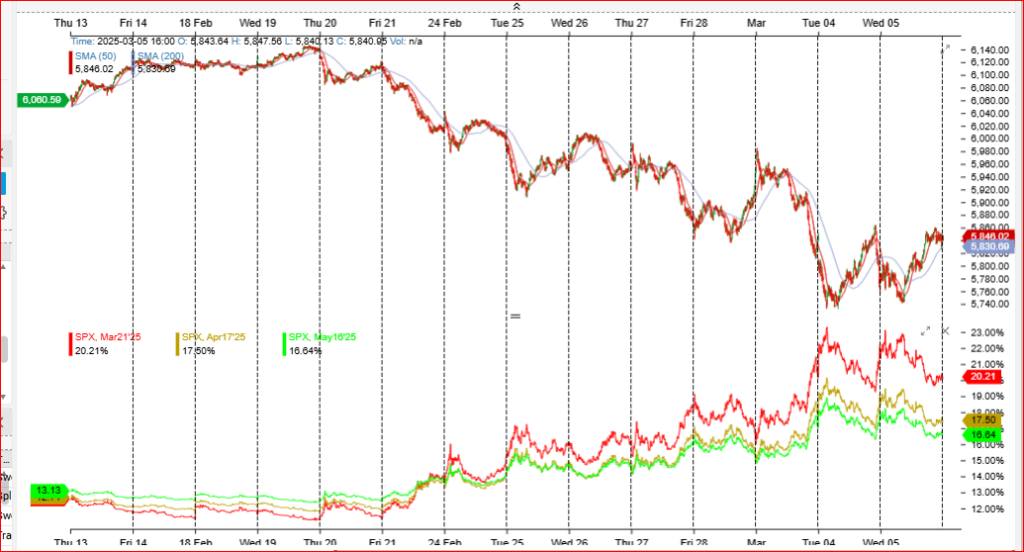
Is implied volatility still climbing?
If I look at the graph below, the top for implied volatility, the red line on the bottom peaked yesterday for a while Wednesday morning. IV has not been able to hold up since SPX has not been able to hold the downside levels.
SPX 20 day chart with Mar, Apr and May IVs on the bottom
SPX is still running 100 dollars a day at least. Today it was almost 200 dollars. IV is so high the market is expecting a 100 dollar move on Thursday. That means whatever caused the run to the 200 moving average is not a lasting phenomenon. Set the trade for a pop back to 5950 but be ready for a move to 5750.
Crazy I know, but setting up two-way trades makes it a lot easier.
To Your Trading Success,
AG
Andrew Giovinazzi
30-Year Trading Pro
See what's hot at option pit
CAPITOL GAINS: SMR Aug16 7 call closed for a 150% gain
DELTA STRIKE: VLY Mar15 8 puts closed for a 88% gain
PFE May17 26 calls closed for a 66% win
OP MENTORING: SPY Mar22/19 510 put calendars and 520 calls for 6.4% gain
OPTION SHOPPER: ERX Mar28 65 calls closed for a 90% gain