

Hey Traders,
Look, there's a chart worth a few minutes of your attention this week.
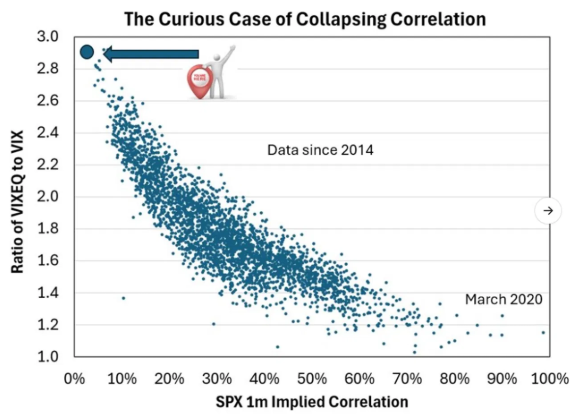
It plots the ratio of single-stock implied vol (the market's forecast for how much the average stock will swing) to index implied vol (the same forecast for the S&P 500 as a whole), set against one-month implied correlation.
Right now we're pinned in the top-left corner, an extreme we haven't seen since the data begins in 2014.
Strip away the jargon and it's one idea.
Index volatility isn't just the average of single-stock volatility. It's that average scaled down by how much the stocks move together. That "move together" number is correlation, and it's the whole game.
Think of it as a tug-of-war. When 500 stocks pull in scattered directions, most of their volatility cancels out at the index level. The VIX (Wall Street's fear gauge) stays low.
Meanwhile the average stock is still whipping around, so single-stock vol stays high. Divide the big number by the small number and the ratio jumps. That's the top-left.
Now imagine the rope pulls taut. A shock hits, correlation spikes, and every stock pulls the same way. The cancellation stops.
Index vol races up to meet single-stock vol, and the ratio collapses toward one. That's the bottom-right of the chart. The dot sitting there is March 2020, the Covid crash.
Correlation ran to nearly 100 percent because everything sold off as one trade. Investors dumped it all: good stocks, bad stocks, the names they actually liked. Much of that selling came down to one thing: people needed cash, so they sold whatever they could.
Here's the part dispersion traders (the pros who bet stocks will drift apart rather than move as a herd) already feel in their bones. The current calm in the VIX isn't built on calm stocks. It rests entirely on low correlation.
Dispersion is doing all the work of holding the index down.
That's a fragile foundation, for two reasons. First, correlation is mean-reverting (it always drifts back to its long-run average), and it reverts violently, not gently. Second, the snapback runs one direction faster than the other.
Correlation can rocket from the floor to the ceiling in a single session, then grind back down over weeks. So the drop in index vol is fast, and the recovery is slow.
The practical takeaway is about where convexity is cheapest. Convexity is protection that pays off bigger and bigger the more the market moves. With implied correlation priced near record lows, around eight on the one-month gauge and the lowest reading in more than two decades, the market is effectively saying these stocks will never agree again.
Index protection sits at the bottom of its relative pricing, while single-stock vol is already high. If you want to own gap risk here, the chance of a sudden, violent lurch, the index is the cheap place to rent it.
A quiet VIX is comforting. This chart is the reminder that quiet and safe aren't the same word. The market has simply moved the risk somewhere you can't see on the front screen.
So I'm looking at VIX call convexity here, options that pay off when fear spikes. Not that I'm massively negative.
But something that breaks this market could break it hard if it gains momentum. And right now, no one seems interested in owning puts (the options that pay off when the market drops). That could be a mistake.
Here for a good time… AND a long time,
Hans