Hey There Income Hunters,
Sometimes market cycles are driven by psychology and other times psychology is driven by cycles.
And what we’ve seen in 2021 has been investor psychology in control.
For instance:
-
-
- In June, the market psychology was that rising demand for raw materials and supply chain bottlenecks would push inflation higher — and the Fed was not concerned.
-
This was the consensus narrative making the inflation trade a crowded trade.
-
-
- Then at the June Fed meeting, Jerome “J-Pow” Powell voiced concern about inflation, and for the first time discussed shifting to a taper or reverse quantitative easing policy.
-
This caused a 180 in investor psychology to a tightening Fed that would squash inflation.
Real assets suffered a minimum of a 10-15% correction and when the Delta variant hit, psychology completed a shift from an inflationary bias to a deflationary tone.
-
-
- Heading into the July Fed meeting, investor psychology was leaning on J-Pow formally announcing a shift to a tighter monetary policy stance.
-
Bingo. J-Pow did a complete flip-flop and actually stated the Fed’s only goal is full employment. Period. No mention of any concern about inflation at this time.
The market is now in the process of completing another 180 shift in psychology back to an inflationary bias with commodities metals and miners on a sharp rise higher.
Today, we’ll take a look at the important charts and signposts to determine the probabilities of another shift back to deflation.
We’ll find that the Fed has shattered investor confidence in our central bank, and that investors will begin to ignore the fruitless cries of supposed transparency …
Notable Chart
The one glaring trade I see as a low risk-/high reward opportunity is to buy put spreads on iShares Treasury 20+ Maturity Bond ETF (Ticker: TLT) …
Below is a look at the weekly chart …
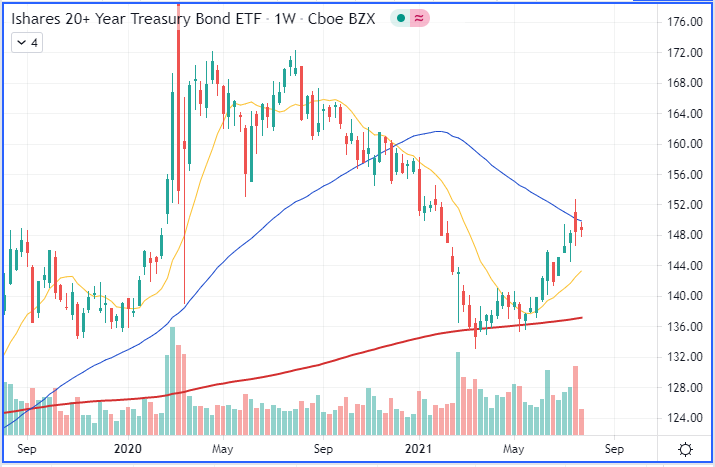
Notice the location of the 50-day moving average. Thursday’s high just touched it and then TLT traded down from there. This gives you a very solid level to set a sell-stop on your trade.
You always want to monitor the volume, as well, and last week there was high volume when investors sold heavily on new highs …
I purchased a TLT 148/145 put spread expiring on Sept. 17, 2021 and paid $1.29 for it.
Tech Tell-Tale
The other thing to monitor is Technology Select Sector SPDR Fund (Ticker: XLK) against TLT for signals on when Tech may lag.
You see, the valuation of mega cap growth stocks is driven by long-term interest rates.
Since they do not deliver high net income today, investors are relying on the future growth potential and that is valued against the alternative — a fixed income derived from Treasury Bonds.
Here is a look at the chart:
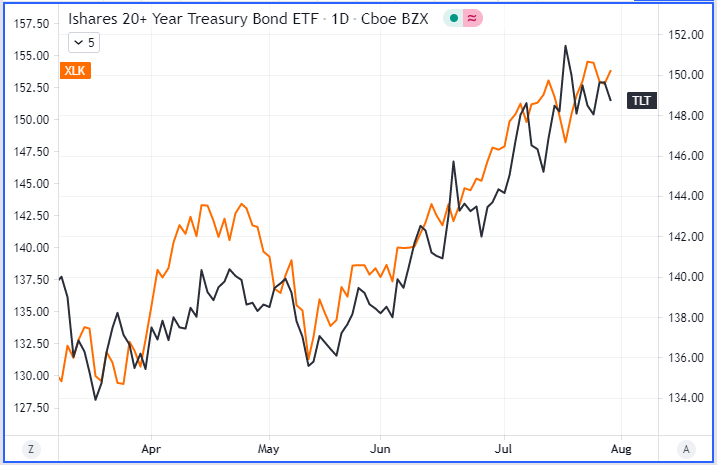
You probably wouldn’t think that there was a tight correlation between TLT and XLK, but his can give you good ideas on trades in one or the other …
I think at this point TLT is mispriced ,although we have to remember that we can’t trust the Fed and they could manipulate the market longer than we can stay solvent.
And don’t forget the central bank has a printing press for dollars and the largest portfolio in the world of Treasury bonds …
So, risk manage the trade and always use sell stops. The setup is very good in TLT. You can buy the put spread and close the position on a close above the 50-day moving average on the weekly chart …
Bring It Home
This is just the beginning of a major change in psychology.
Now is the time to be more aggressive in putting trades on with the trend. The “trend is your friend” when you are early in the cycle.
Late in the cycle you want to become a contrarian when you have the signposts that tell you to anticipate a change in psychology.
Live and Trade With passion My Friends,
Griff